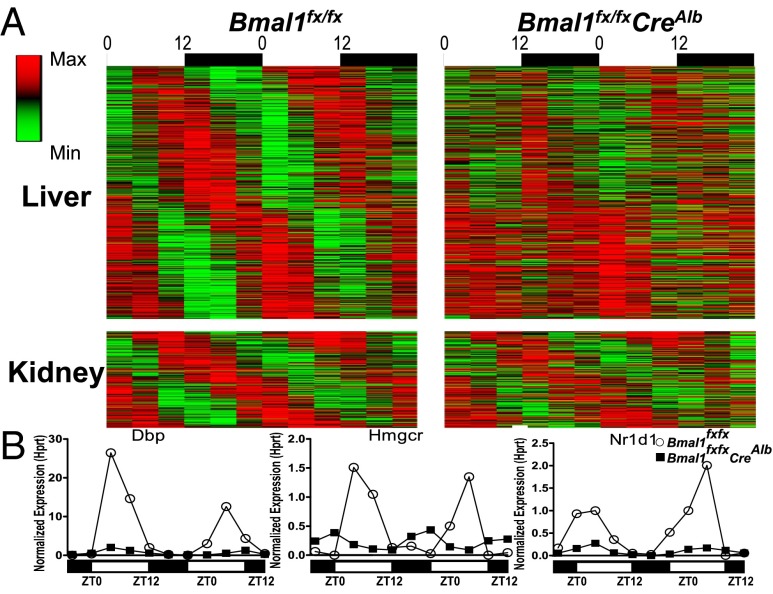
Fig. 2.
Microarray analysis reveals the independence of the Bmal1-driven hepatocyte clock. (A) Heatmap of cycling transcripts in liver (Upper) and kidney (Lower). WT and Bmal1fx/fxCreAlb mice were killed every 4 h over two different days. (Left) Transcripts with corrected P value < 0.03 in WT liver and kidney are shown and ordered by peak phase. (Right) Ninety percent of cycling transcripts in liver and 16% of cycling transcripts in kidney were significantly different in Bmal1fx/fxCreAlb and WT mice. (B) Validation of arrays by multiplex PCR of cycling transcripts Dbp, Nr1d1 (Reverb-a), and Hmgcr internally normalized to Hprt in WT mice (open circles) and Bmal1fx/fxCreAlb mice (filled squares). Also see Fig. S3 and Table S1.

