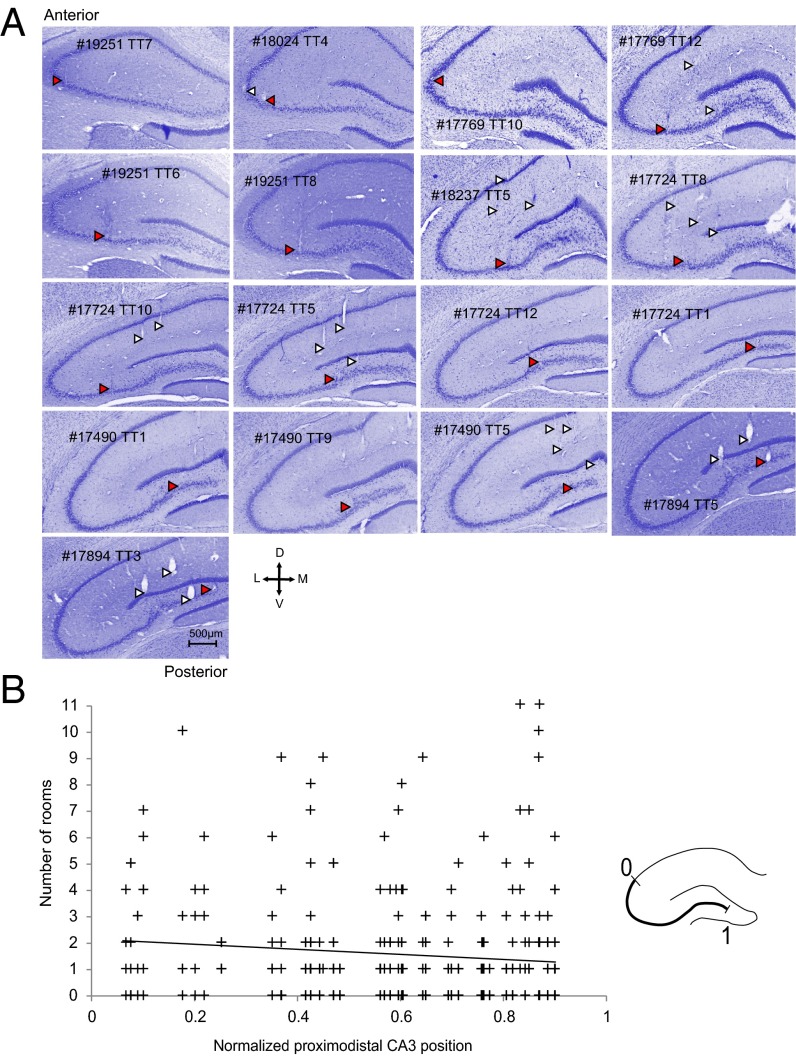
Fig. 2.
Tetrode locations of each animal. (A) Individual panels show Nissl-stained coronal sections through the hippocampus. Rat numbers (five digits) and tetrode numbers (TT) are indicated. Tetrode traces are indicated with arrowheads. Red arrowheads indicate tetrodes with cells that were active in more than five rooms. (Scale bar for all images, 500 µm.) (B) Scatterplot showing number of rooms that a cell was active in as a function of position along the proximodistal axis of CA3. Each cross corresponds to one cell. (Inset) Schematic showing proximodistal axis scaled from 0 to 1. Cells active in multiple rooms were not confined to a specific location on the proximodistal axis (r = −0.09, P > 0.05).

