Fig. 4.
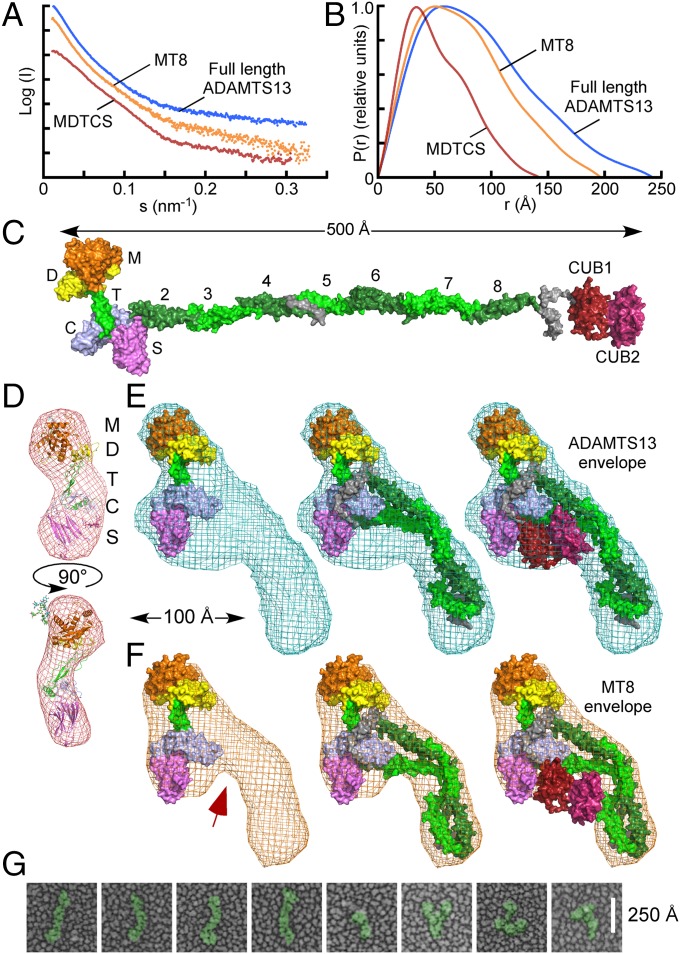
ADAMTS13 structure by EM and SAXS. Scattering profiles (A) and pair distribution functions (B) for MDTCS, (red) MT8 (orange), and ADAMTS13 (blue). (C) Molecular model of ADAMTS13. (D–F) Ab initio envelopes calculated from scattering profiles for (D) MDTCS (red mesh), (E) ADAMTS13 (blue mesh), or (F) MT8 (orange mesh) superimposed on an atomic model of MDTCS (D, cartoon; E and F, surface), MT8, or ADAMTS13 (E and F, surface). The arrow indicates a difference between MT8 and ADAMTS13 maps that corresponds to the proposed location of CUB domains. (G) Quick-freeze deep-etch EM of ADAMTS13.

