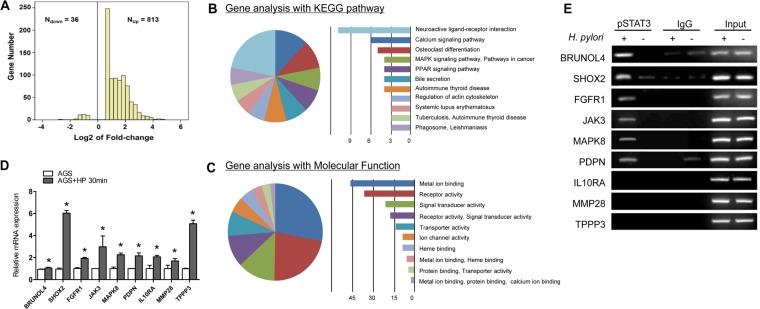
Figure 4. Identification of key tumorigenic-regulators directly controlled by STAT3 following H. pylori infection.
(A) 849 genes were differently expressed in ATCC43504-infected AGS relative to control group. (B) Top 11 dysregulated pathways using the KEGG database. (C) Gene ontology of the cDNA microarray. (D) Quantitative RT-PCR validation of the 9 potential targets in AGS cells treated with ATCC43504 for 30 min relative to the untreated cells. GAPDH was used as an internal control. (E) Confirmation of the potential pSTAT3 target genes by ChIP-PCR using anti-pSTAT3 (Tyr705) antibody or irrelevant antibody against IgG (negative control) on ATCC43504 infected and non-infected AGS cells. Input represents the genomic DNA. *P < 0.05.

