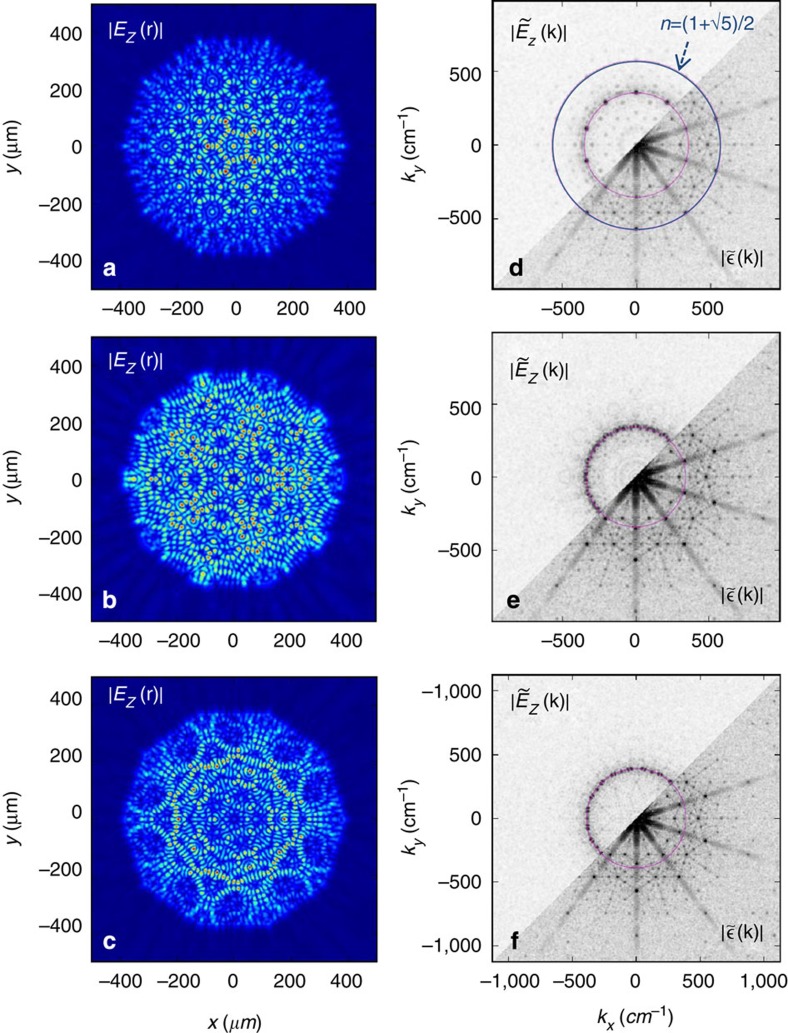
Figure 2. Simulated optical modes.
(a–c) Computed 2D spatial profiles of the electric field modulus for the higher Q optical modes of Fig. 1c: (a) P, (b) L, and (c) H. (d–f) Fourier transform  of the optical mode spatial profiles (upper left) in the reciprocal space for (d) P, (e) L, and (f) H (upper left half), plotted together with the form factor
  of the designed quasi crystal (bottom-right half). f(k) peaks at values kp identified by heavy dots. To identify the Bragg peaks responsible for the feedback, one can overlap the circles of radius nkp, for each n corresponding to values that satisfy the Bragg equation; the circumference with n=(1+√5)/2 is shown in blue in (d) and perfectly intersects strong resonances of
  indicating a five-wave diffraction as the origin of the feedback for the related optical mode P. The circle of radius kp is also plotted in pink to show Bragg peaks of S(k) responsible for vertical extraction.

