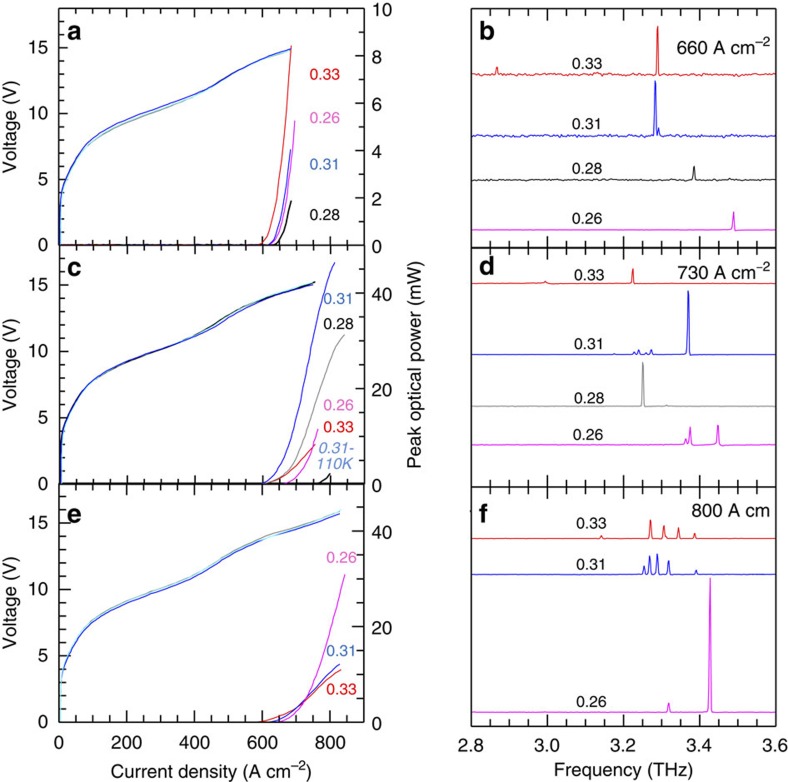
Figure 4. Light–current–voltage and spectral characterization.
(a,c,e) Power–current-density (LJ) and voltage–current-density curves as a function of R=r/a measured at 10 K for different sets of devices designed with a fixed spatial length scale: (a) a=23, (c) 22 and (e) 21 μm; the corresponding device areas were about 0.74, 0.67 and 0.60 mm2, respectively. Lasers are driven with 1 μs current pulses at a 1% duty-cycle. For the device with a filling factor R=0.31 and a=22 μm, the corresponding LJ characteristic at a heat sink temperature of 110 K measured with a 2% duty-cycle is also shown. The optical power scales were not adjusted to take into account the 78% transmission coefficient of the thermoplastic cyclic olefin cryostat window and the 90% collection efficiency. (b,d,f) Corresponding laser output spectra for the sets of devices designed with (b) a=23, (d) a=22 and (f) a=21 μm, and different filling factors. The spectra were acquired in rapid scan mode with a resolution of 0.125 cm−1 using a Fourier transform interferometer spectrometer and a deuterated triglycine sulfate (DTGS) pyroelectric detector.

