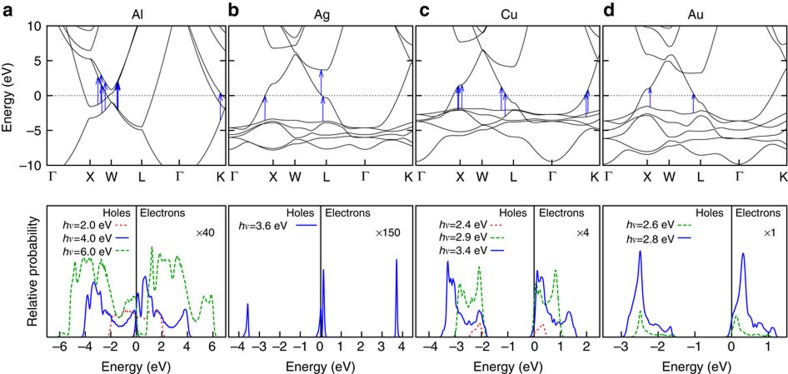
Figure 3. Allowed transitions and hot-carrier energy distribution.
PBEsol+U band structure and predicted plasmonic hot-carrier energy distributions for (a) aluminium, (b) silver, (c) copper and (d) gold. The bottom panels show the energy distribution of hot electrons (positive energies relative to Fermi level at 0) and hot holes (negative energies) for various photon and plasmon energies, hν. The top panels show the band structure and arrows mark the allowed transitions for the plasmon energy plotted with a solid line in the corresponding bottom panel. Contrast the almost uniform energy distribution of electron and hole energies in aluminium with the hole-dominant energy distribution in copper and gold and the bimodal hot-hole and hot-electron distributions in silver due to the position of the d bands.

