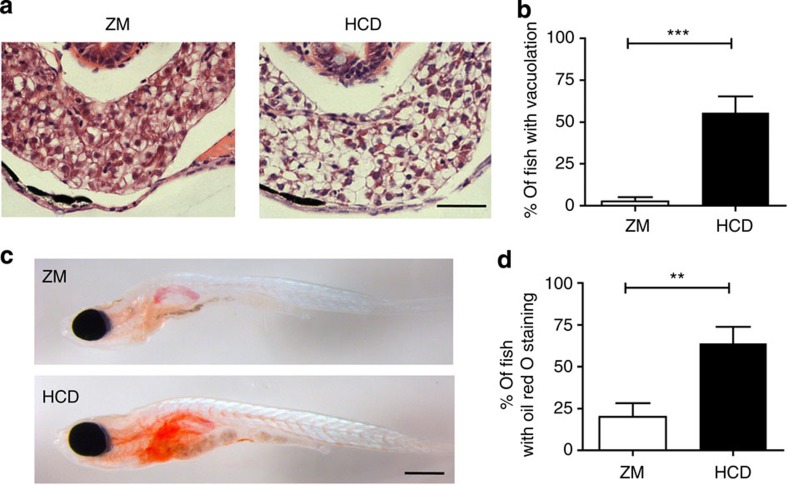
Figure 6. Extended HCD induces steatosis in the liver.
(a) Representative images of paraffin transverse sections stained with haematoxylin and eosin of the liver of 15 dpf larvae fed ZM control or HCD for 10 days. Scale bar, 100 μm. (b) Percentage of fish showing vacuolation in the liver. n≥34, pooled from two experimental replicates. (c) Representative image of whole-mount Oil Red O-stained 15 dpf larvae fed ZM control or HCD for 10 days. Scale bar, 500 μm. (d) Percentage of fish showing Oil Red O staining in the liver. n=25, pooled from two experimental replicates. Error bars represent s.e.m. Mann–Whitney test. ***P<0.001 and **P<0.01.

