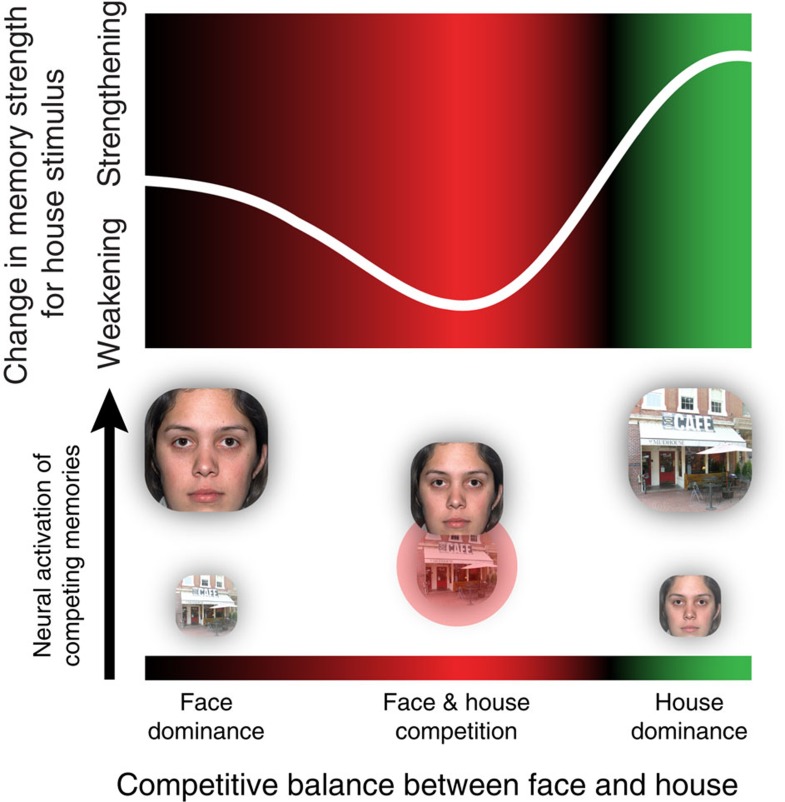
Figure 1. Hypothesized ‘plasticity curve’ describing how competition between memories drives learning.
If a memory competes and clearly wins, it ends up being highly active and is strengthened; if the memory competes but does not win, it ends up being moderately active and is weakened; if the memory does not compete strongly, nothing happens. The background colour redundantly codes whether different levels of memory activation are linked to weakening (red) or strengthening (green). The diagram below the curve depicts different states of face/house competition that could occur during the rendezvous example in the text. When switching from the ‘house dominance’ state on the right to the ‘face dominance’ state on the left (or vice versa), the face and house pass through the ‘weakening zone’ of the plasticity curve where they are thrust into close competition with each other, resulting in moderate levels of house activity and (through this) weakening of the house memory. The greater the amount of time that the house spends in this ‘weakening zone’, the worse subsequent memory for the house will be.

