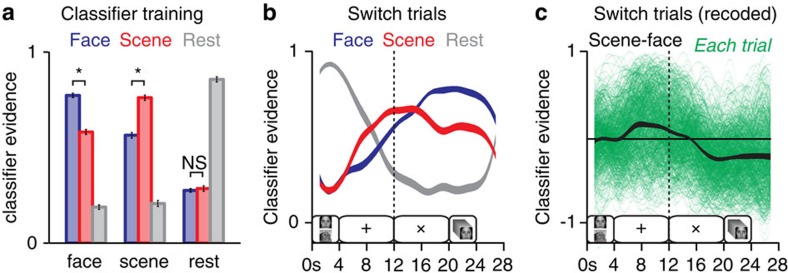
Figure 3. Pattern classification of fMRI data.
(a) Classifier evidence scores for Phase 1 data, obtained by training the classifier on all but one Phase 1 block and testing on the remaining block. Face evidence is blue, scene evidence is red and resting-state evidence is grey (*P<0.001, face versus scene, paired t-test). (b) Trial-averaged decoding of switch trials from Phase 2, with evidence values interpolated between discrete data points every 2 s. Trial events are diagrammed along the horizontal axis. (c) Recoded classifier evidence scores (‘scene–face’) for switch trials overlaid on a distribution of single-trial traces from every participant. (Error bars and ribbon thickness indicate the s.e.m. across participants, n=21; see Supplementary Figs 2 and 3 for individual-subject versions of these plots). Note that in these plots classifier evidence scores were not shifted to account for haemodynamic lag.

