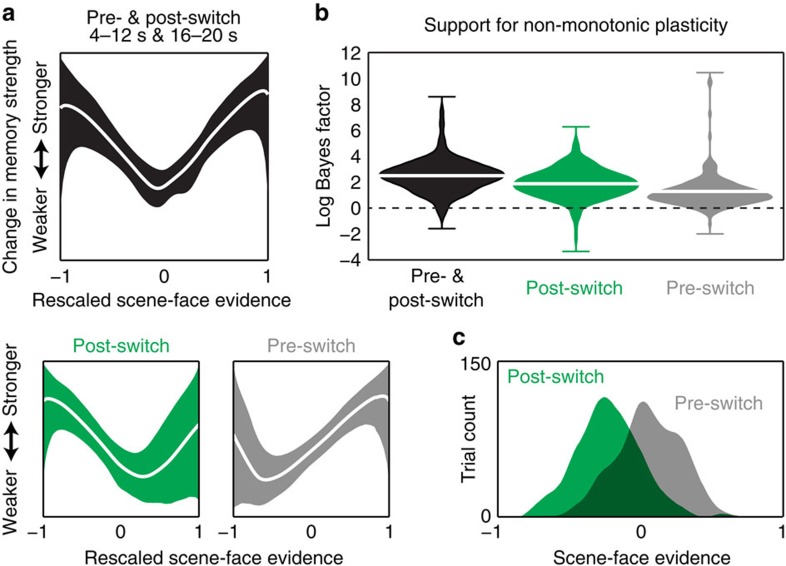
Figure 4. Relating classifier evidence on switch trials to subsequent recognition memory.
(a) Empirically derived estimates (generated using the Bayesian P-CIT algorithm7) of the ‘plasticity curve’ relating scene–face evidence on switch trials to Phase 3 subsequent memory strength (operationalized as recognition confidence). Within each box, the line shows the mean of the posterior distribution over curves and the ribbon shows the 90% credible interval (such that 90% of the curve probability mass lies within the ribbon). The horizontal axis shows scene–face classifier evidence scores rescaled so that the minimum classifier evidence value=−1 and the maximum classifier evidence value=1; the vertical axis represents the change in subsequent memory strength. The box on the top shows the estimated curve when behavioural outcomes are modelled as depending on the summed effects of pre-switch (4–12 s) and post-switch (16–20 s) classifier evidence. The two boxes on the bottom show the estimated plasticity curve when behavioural outcomes are modelled as depending only on post-switch or pre-switch classifier evidence, respectively (n=21). (b) Violin plots describing the balance of evidence (operationalized in terms of log Bayes factor) in favour of the non-monotonic plasticity hypothesis, shown separately for the three analysis conditions. These plots show the probability density (using kernel density estimation) of the log Bayes factor derived from 200 bootstrap iterations for each analysis condition. The height of each plot indicates the full range of the data and the white marker indicates the mean. Positive values of the log Bayes factor correspond to evidence in favour of the non-monotonic plasticity hypothesis and negative values correspond to evidence against the hypothesis. (c) Histograms of scene–face classifier evidence during pre-switch (4–12 s; grey) and post-switch (16–20 s; green) intervals.

