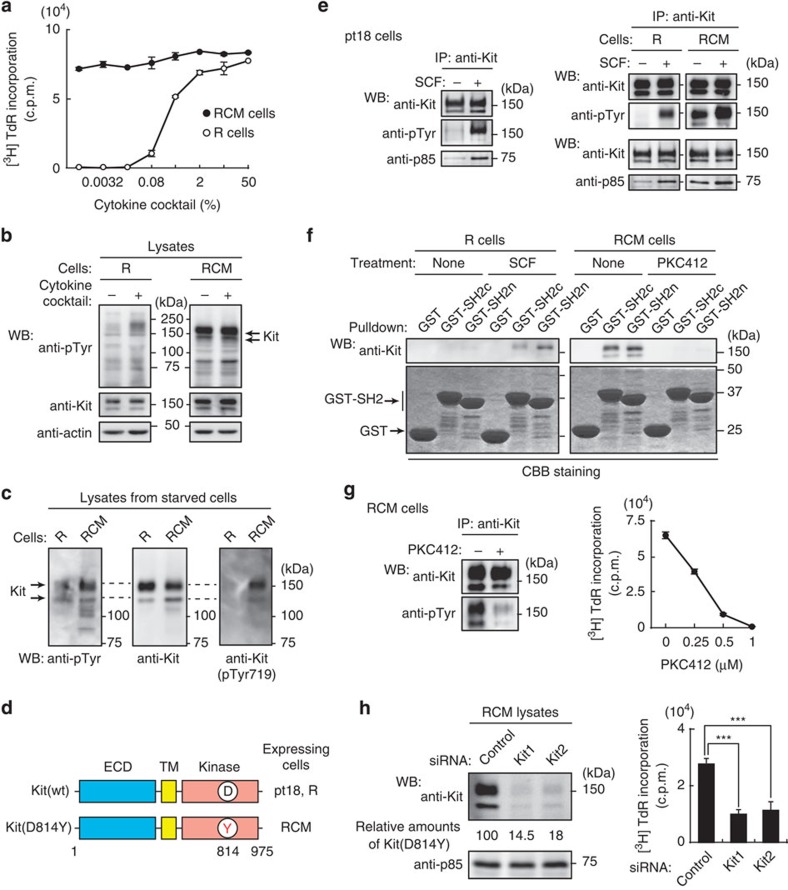
Figure 1. Kit(D814Y) is essential for autonomous proliferation of mouse RCM cells.
(a) RCM and R cells were cultured in the indicated cytokine cocktail for 48 h. Proliferation was assessed by [3H]-thymidine incorporation into R (open circles) and RCM cells (filled circles). Results (c.p.m.) are means±s.d. (n=3). NB: RCM cells proliferated without the cytokine cocktail. (b,c) Expression of constitutively phosphorylated Kit in RCM cells. Starved R and RCM cells were treated with the cytokine cocktail for 5 min. Lysates were immunoblotted with anti-phosphotyrosine (anti-pTyr), anti-Kit, anti-Kit(pTyr719) and anti-actin. Arrows indicate constitutively tyrosine-phosphorylated protein corresponding to Kit in RCM cells. (d) Schematic representations of normal Kit and Kit(D814Y) showing the extracellular domain (ECD), the transmembrane domain (TM), the kinase domain, Asp814 in the kinase domain (D in black) and the tyrosine mutation at 814 (Y in red). (e) Constitutive activation of Kit(D814Y). Starved pt18, R, and RCM cells were treated with 50 ng ml−1 SCF for 5 min. Kit was immunoprecipitated then immunoblotted. (f) GST-pulldown. RCM or R cells were treated with 1 μM PKC412 (Kit kinase inhibitor) for 24 h or 50 ng ml−1 SCF for 5 min, respectively. Kit was pulled down with GST-SH2c or GST-SH2n, and amounts of Kit pulled down was assayed by immunoblotting. GST proteins were visualized by Coomassie staining. (g) Effect of PKC412 on the kinase activity of Kit(D814Y). RCM cells treated with 1 μM PKC412 were cultured for 24 h. Anti-Kit immunoprecipitates were immunoblotted. The graph shows the levels of [3H]-thymidine incorporation into RCM cells at the indicated PKC412 concentrations. Results (c.p.m.) are means±s.d. (n=3). (h) RCM cells were transfected with control siRNA or Kit siRNAs (Kit1 or Kit2) and cultured for 20 h. Lysates were immunoblotted with anti-Kit and anti-p85. Amounts of Kit(D814Y) are expressed relative to control cell lysate, after normalization with p85. The graph shows the levels of [3H]-thymidine incorporation into RCM cells. Results (c.p.m.) are means±s.d. (n=3). Data were subjected to one-way ANOVA with Dunnett’s multiple comparison post-hoc test. ***P<0.001.

