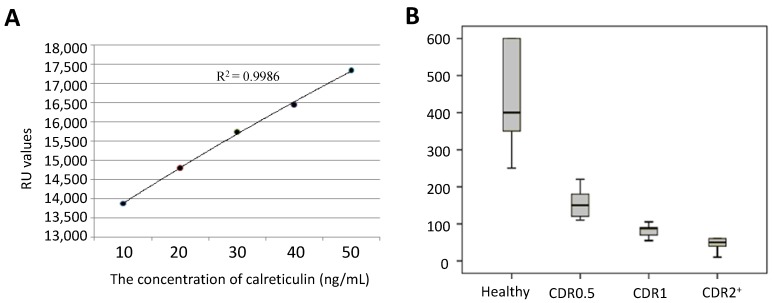
Figure 2.
Measurement of serum calreticulin using ELISA. (A) A standard curve was plotted between the concentration of calreticulin and absorbing value at 450 nm and (B) A bar diagram shows the differences in serum levels of calreticulin among AD patients with different Clinical Dementia Rating (CDR) scores.

