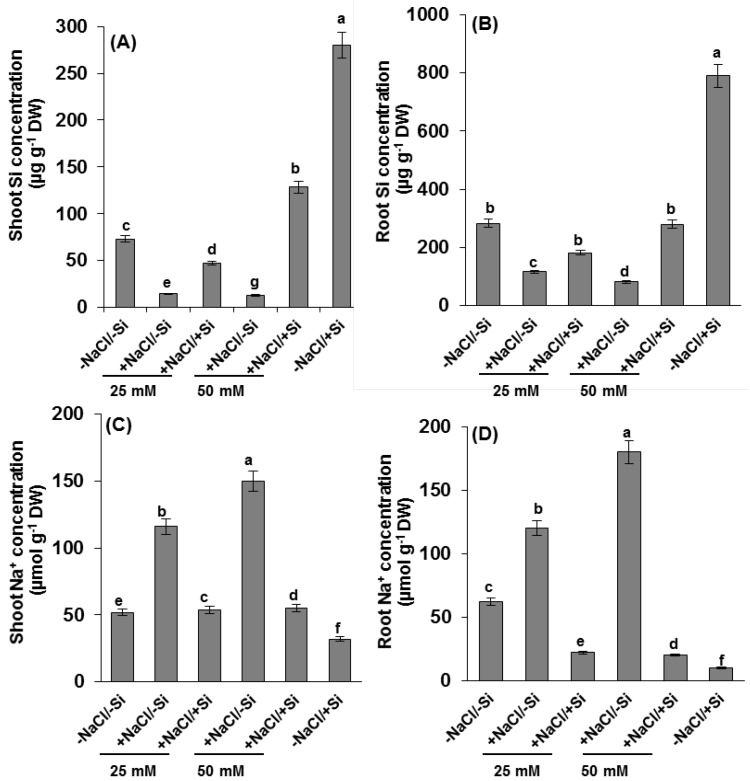
Figure 3.
Changes in concentration of (A,B) silicon (Si) and (C,D) Na+ ions in roots and shoots of tomato (Solanum lycopersicum L.) as affected by NaCl/Si combined treatments along with Control [−NaCl/−Si]: −Si with NaCl [25 mM, +NaCl/−Si], +Si with NaCl [25 mM, +NaCl/+Si], −Si with NaCl [50 mM, +NaCl/−Si], +Si with NaCl [50 mM, +NaCl/+Si] and with additional control +Si without NaCl [−NaCl/+Si]. Vertical bars indicate ± S.E. of the means for n = 5. Means denoted by the different letter are significantly different at p < 0.05 according to the Tukey’s studentized range test.

