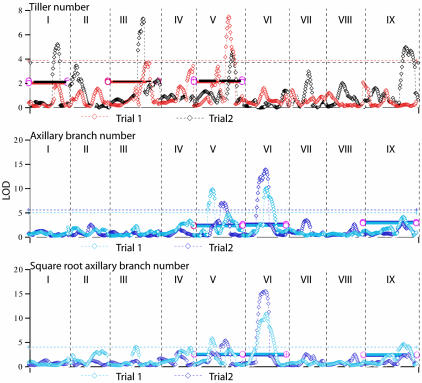
Fig. 3.
Likelihood profiles for tillering, axillary branch number, and square root transformed axillary branch number in the two trials. Each graph shows the likelihood in LOD scores of a QTL at 2-cM intervals along the nine linkage groups (here represented as lying end to end and numbered I to IX). The significance level at the genome-wide level of P < 0.05 level is shown for each trait in the appropriately colored dashed line; the significance level at the chromosome-wide level of P < 0.01 is shown by solid lines for the three chromosomes where shared QTL between trials are found.

