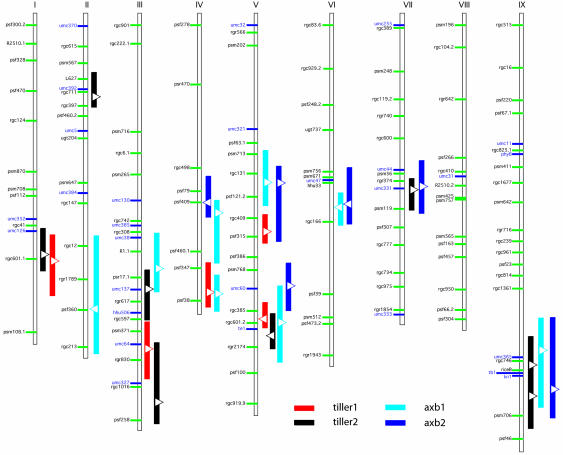
Fig. 4.
Genome map of the S. italica × S. viridis population. Shown is the location of major QTL and mapped genes for tillering and square root transformed axillary branch number. QTL are shown with 1-LOD support intervals. Triangles on QTL indicate position of maximum LOD score; direction of triangle indicates direction of effect (right, increase; left, decrease). Markers with green bars are from the original genome map and were used in the QTL analyses; those with blue bars represent maize markers or genes added for comparative analysis.

