Figure 7.
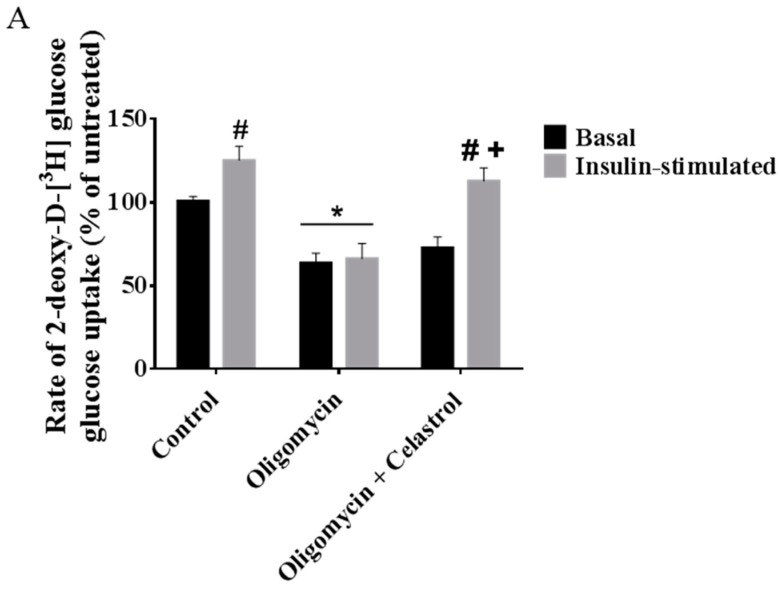
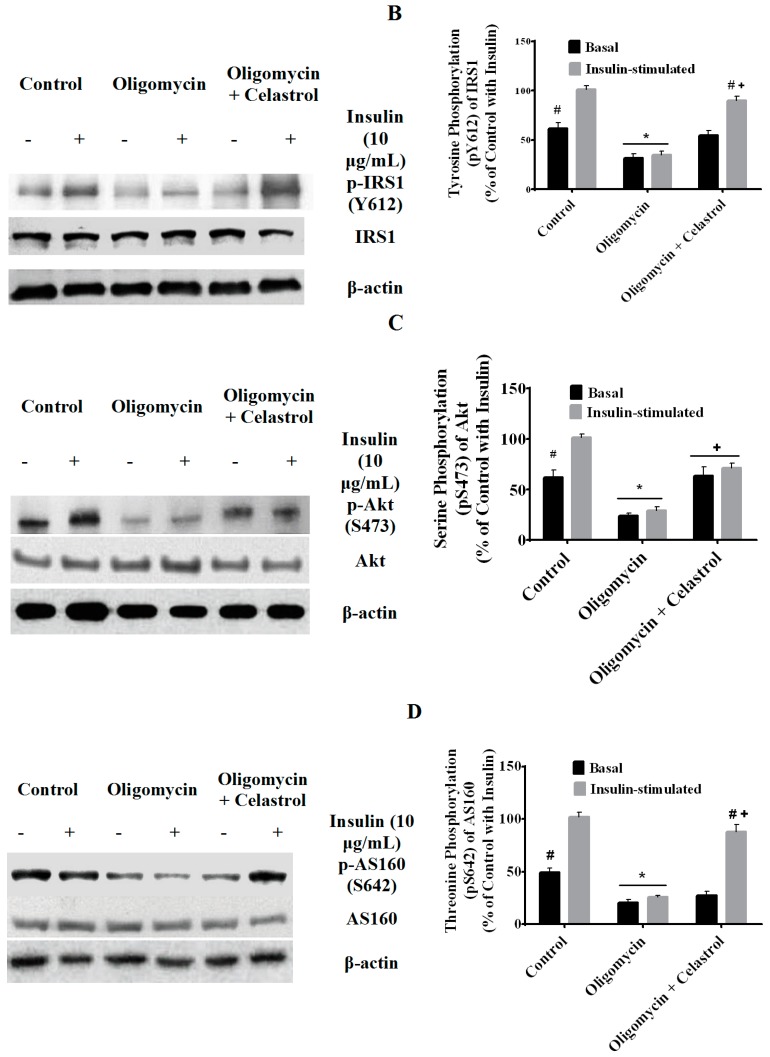
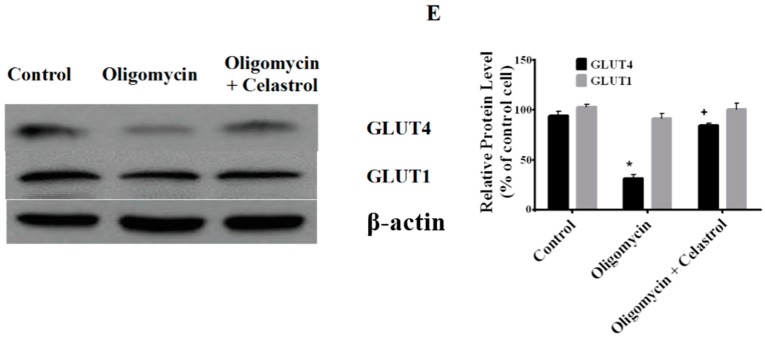
Effects of celastrol treatment on insulin signaling cascades and glucose transporter in differentiated 3T3-L1 adipocytes with mitochondrial dysfunction. Representative Western blot of insulin signaling activity for (A) glucose uptake; (B) Tyr612 phosphorylation of IRS1; (C) Ser473 phosphorylation of Akt; (D) Thr642 phosphorylation of AS160; (E) and expression level of glucose transporter (GLUT4 and GLUT1) in whole-cell lysates were determined. Fully differentiated 3T3-L1 adipocytes were incubated in serum-free DMEM overnight then treated with 10 µg/mL oligomycin and 5 µM celastrol for 48 h. Insulin (10 μg/mL) was added into plate for 30 min at 37 °C. β-actin was used as loading control. Protein levels measured were normalized against β-actin. * p < 0.05 vs. untreated control; # p< 0.05 vs. basal rate; + p < 0.05 vs. oligomycin-treated cells.


