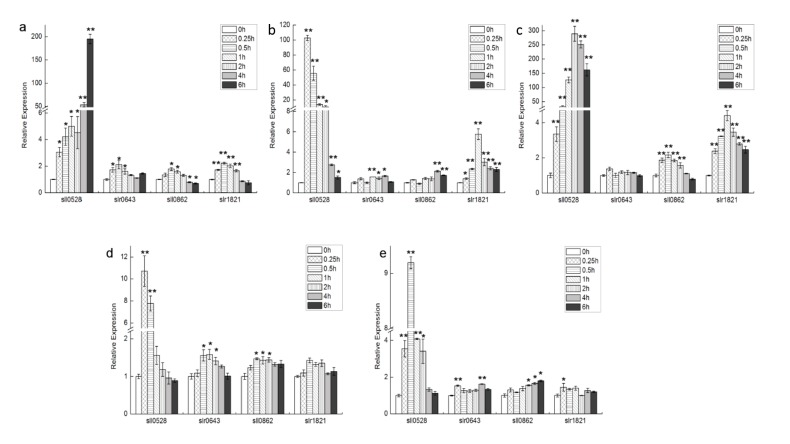
Figure 1.
Transcriptional profiles of four S2P homologs under different conditions. Time course expression profile of sll0528, slr0643, sll0862 and slr1821 genes under salt (a); hyperosmotic stress (b); cold (c); high light (d) and mixotrophic growth (e) were analyzed by quantitative real-time RT-PCR. Significant differences were indicated as * for p < 0.05, and ** for p < 0.01.

