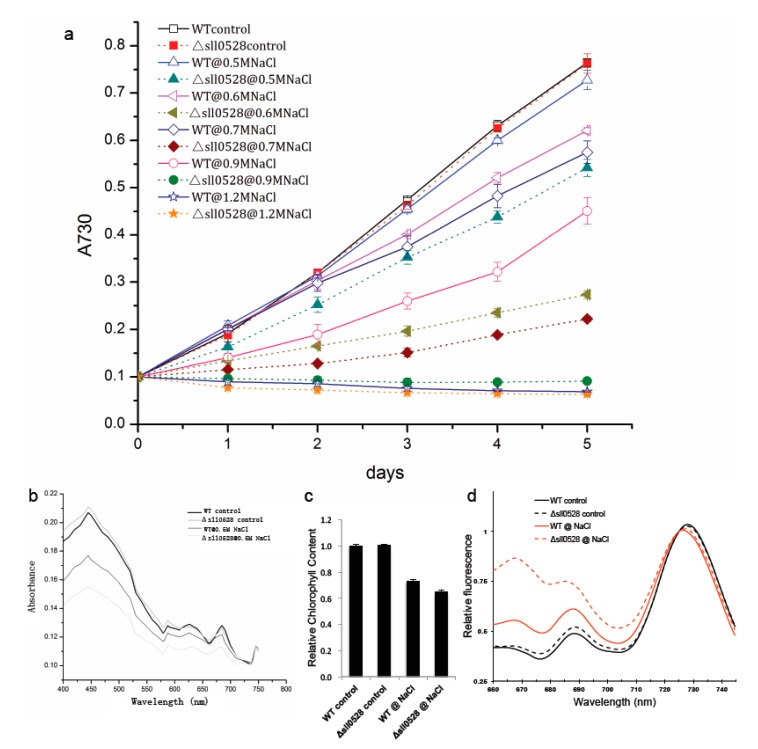
Figure 3.
Increased sensitivity of sll0528 mutant to salt stress. (a) Growth curve of wild type (WT) and sll0528 mutant (Δsll0528) at different concentration of NaCl (0.5, 0.6, 0.7, 0.9, and 1.2 M respectively). Significant differences were observed between mutant and wild type from the 2nd day to 5th day at NaCl of 0.5, 0.6, 0.7 and 0.9 M (p < 0.05). Initial OD730 was 0.1. Each data point represents the mean of at least three independent biological replicates, and the error bars denote SD; (b) Absorption spectra of wild type and sll0528 mutant 24 h after transfer to 0.5 M NaCl, normalized to OD730; (c) Relative chlorophyll content of wild type and mutant; (d) The 77 K fluorescence emission spectra of wild type and mutant with excitation at 435 nm. Spectra were normalized to emission at 725 nm.

