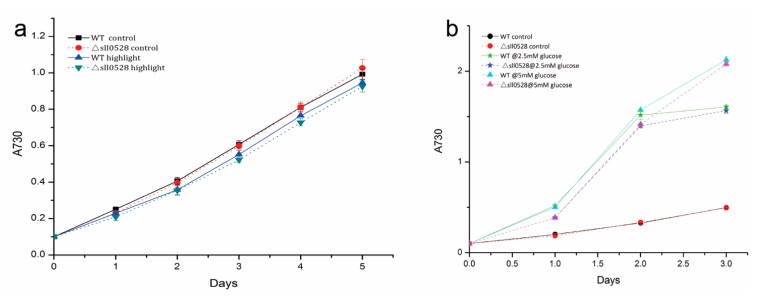
Figure 6.
(a) Growth curve of wild type (WT) and sll0528 mutant (Δsll0528) in continuous light of control (30 μmol·m−2·s−1) and high light (150 μmol·m−2·s−1); (b) Growth curves of wild type and sll0528 mutant under mixotrophic growth condition with different concentration of glucose. Initial OD730 was 0.1 when the condition was changed. Each data point represents the mean of at least three independent biological replicates, and the error bars denote SD.

