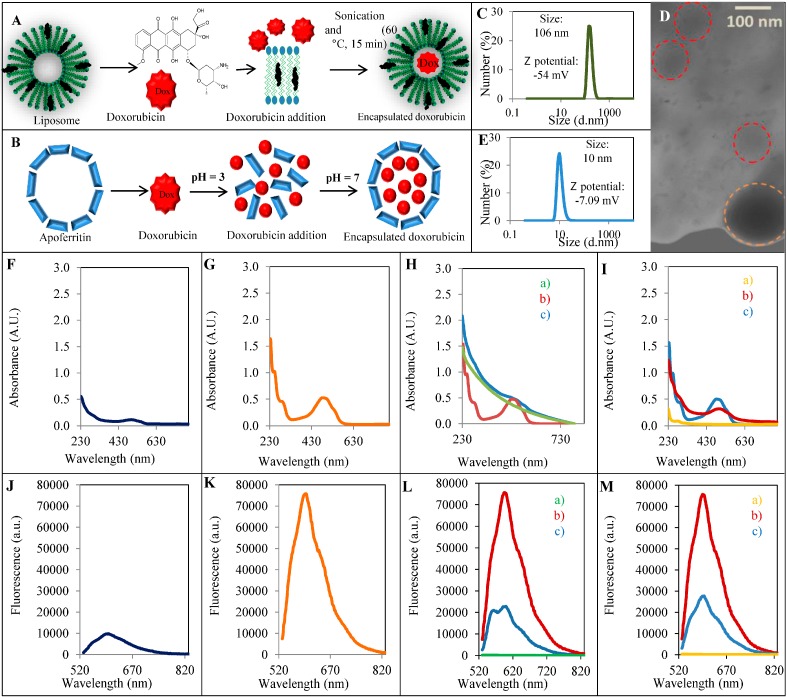
Figure 1.
Scheme of encapsulation of doxorubicin into (A) the liposome modified by cholesterol and (B) apoferritin. (C) Size distribution of liposome and (D) microphotography of liposomes. Liposomes are highlighted with a circle (red circle = 100 nm and orange circle = 200 nm); (E) Size distribution of apoferritin. Absorbtion spectra in the range 230–800 nm of (F) 100 µg/mL Myocet; (G) Epirubicin; (H) Liposome (a), Doxorubicin (b), Encapsulated Doxorubicin into the liposome (c); (I) Apoferritin (a), Doxorubicin (b), Encapsulated Doxorubicin into the apoferritin (c); Emission spectra in the range 520–820 nm of (J) 100 µg/mL Myocet; (K) Epirubicin; (L) Liposome (a), Doxorubicin (b), Encapsulated Doxorubicin into the liposome (c); (M) Apoferritin (a), Doxorubicin (b), Encapsulated Doxorubicin into the apoferritin (c). The excitation wavelength was 510 nm.

