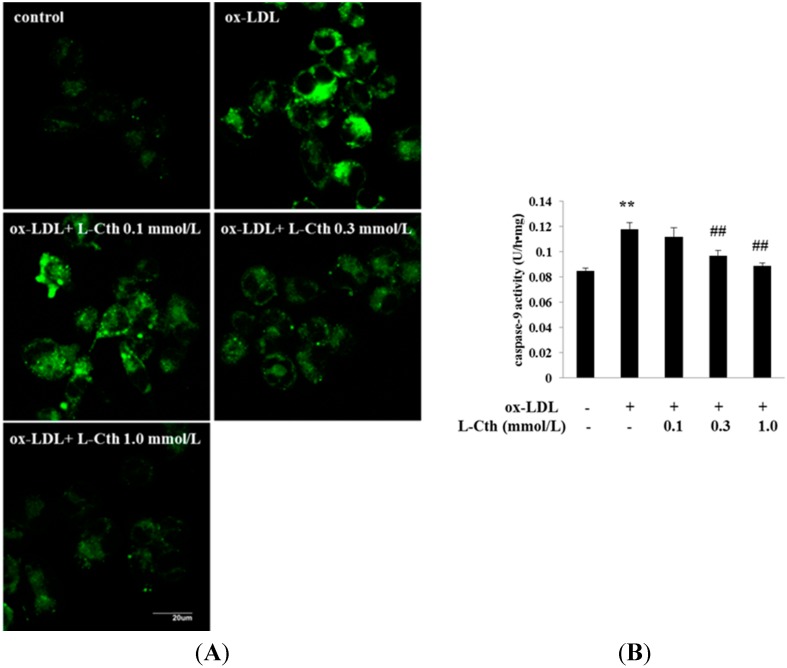
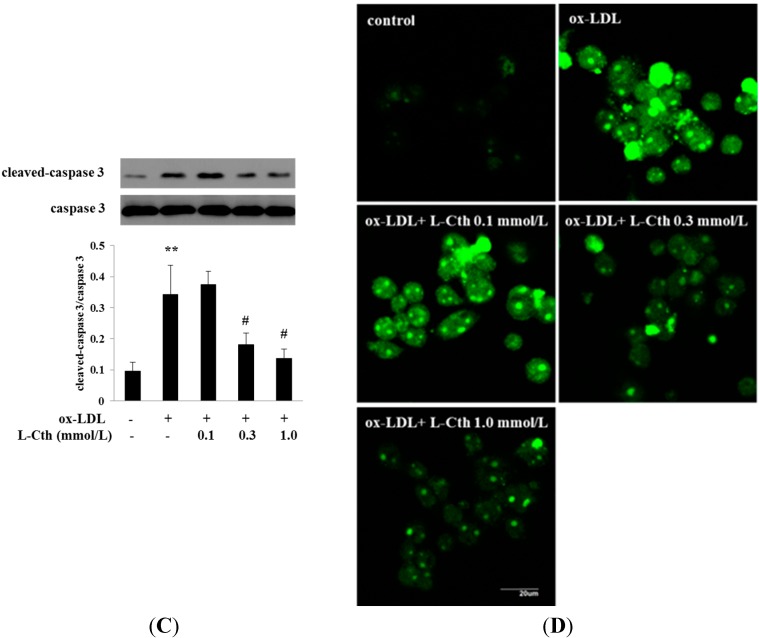
Figure 5.
Changes in caspase-9 activities, cleavage of caspase-3, and cell apoptosis in human macrophages. (A) Caspase-9 activity detected by living cells caspase-9 Fluo-staining Kit; (B) Quantitative analysis of caspase-9 activities measured by cell caspase-9 assay; (C) Cleavage of caspase-3 analyzed by western blotting; (D) Cell apoptosis examined by TUNEL assay. l-Cth: l-cystathionine; ** p < 0.01 compared with control group; ## p < 0.01 compared with ox-LDL group; # p < 0.05 compared with ox-LDL group. Data are presented as mean ± SD of three independent experiments performed in triplicate.


