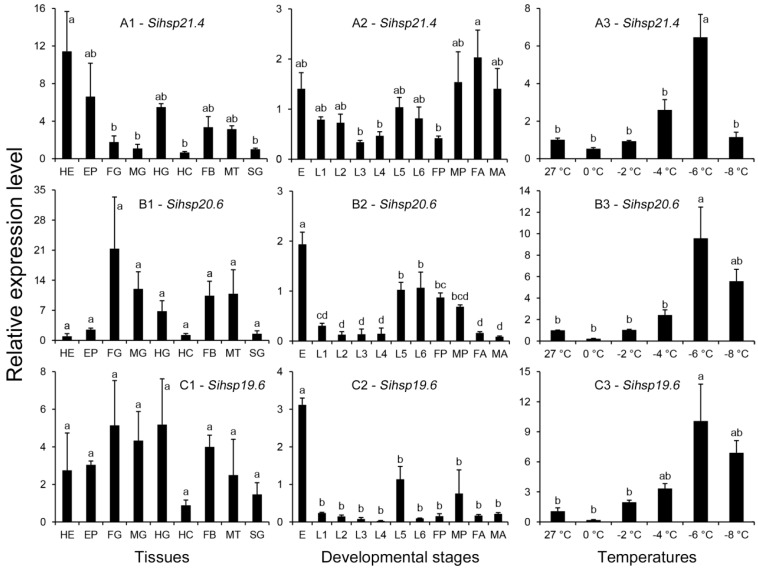
Figure 5.
Relative mRNA expression levels of Sihsp21.4 (A); Sihsp20.6 (B); and Sihsp19.6 (C) in different tissues of the 5th instar larvae (1), different developmental stages (2), and under low-temperature stress (3). HE: Head; EP: Epidermis; FG: Foregut; MG: Midgut; HG: Hindgut; HC: Haemocytes; FB: Fat body; MT: Malpighian tubules; SG: Salivary glands; E: Egg; L1: First instar larva; L2: Second instar larva; L3: Third instar larva; L4: Forth instar larva; L5: Fifth instar larva; L6: Six instar larva; FP: Female pupa; MP: Male pupa; FA: Female adult; and MA: Male adult. Each treatment includes three replicates. The data are denoted as mean ± SE. Different letters above bars represent significant differences in the relative expression levels at the 0.05 level (Tukey’s multiple range test).

