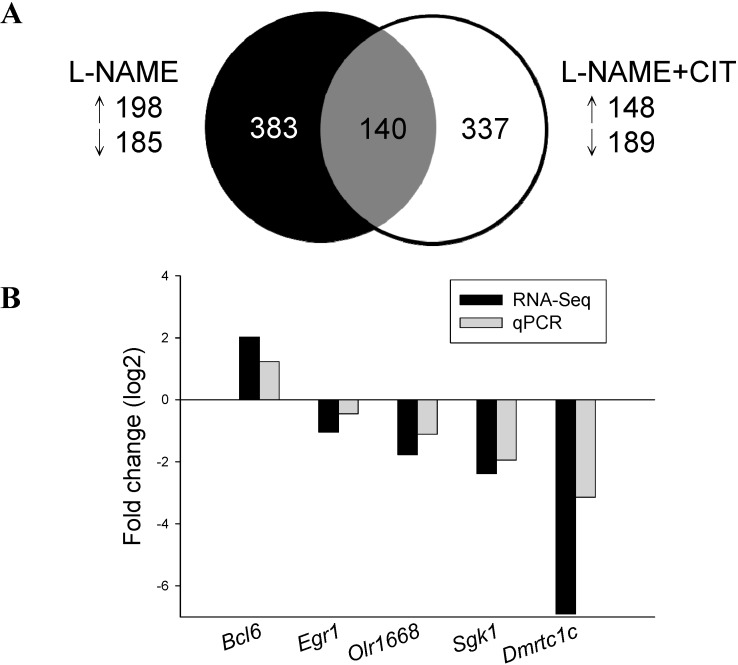
Figure 1.
(A) Venn diagram depicting unique and shared (over-lapping circles) sets of differentially expressed genes (DEGs) in the kidney between maternal l-NAME therapy (black circle) and l-NAME plus l-citrulline therapy (white circle) at 12 weeks of age; (B) Confirmatory analysis of kidney gene expression by qPCR. Individual gene expression was determined by qPCR and expressed as fold change in log base 2 vs. control and graphed alongside fold change derived from RNA-Seq analysis.

