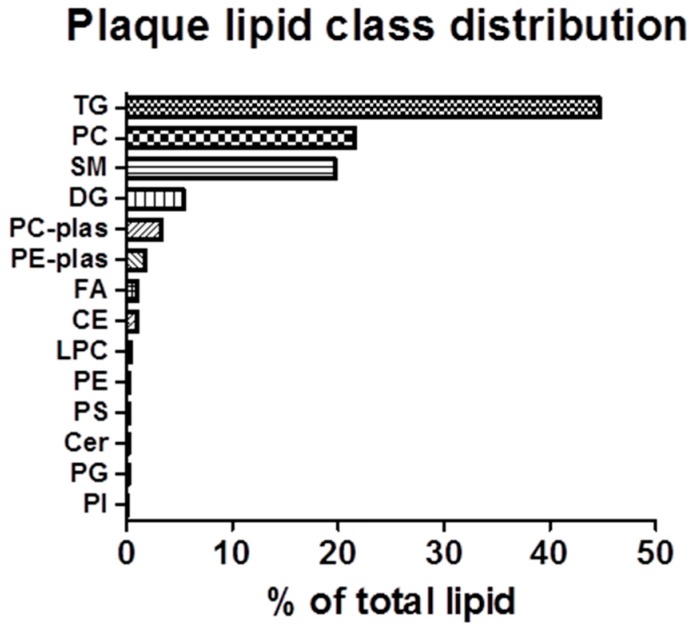
Figure 3.
Summary of aortic lipid class distribution: Targeted analysis of lipids was conducted on full-length aortae isolated from rabbits fed the HC diet by UPLC/TOF-MS. Data is expressed as the percent of the lipid class of the total lipid content in the aorta, calculated as the total peak area of each lipid class, divided by the total peak area of all lipid classes. TG: Triacylglycerol; SM: Sphingomyelin; PC: Phosphatidylcholine; DG: Diacylglycerol; FA: Fatty acid; PE-plas: Phosphatidylthanolamine; PC-plas: Phosphatidyl choline; CE: Cholesteryl ester; Cer: Ceramide; PS: Phosphatidylserine; LPC: Lyso-phosphatidic acid; PE: Phosphatidylethanolamine; PG: Phosphatidylglycerol; and PI: Phosphatidylinositol.

