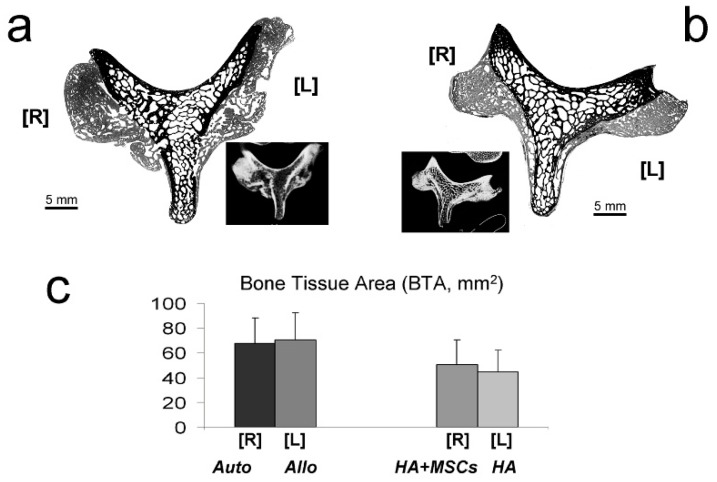
Figure 7.
Bone histomorphometry. Examples of digitized images of cross-sectioned vertebrae from Auto- [R], and Allo- [L] groups (a); and HA + MSCs [R], and HA [L] groups (b), processed to measure new bone tissue area (BTA, in mm2). Original pixel size was 5.2 µm. Insets show correlated axial CT scans; in (c) a graphic representation of those measures is shown.

