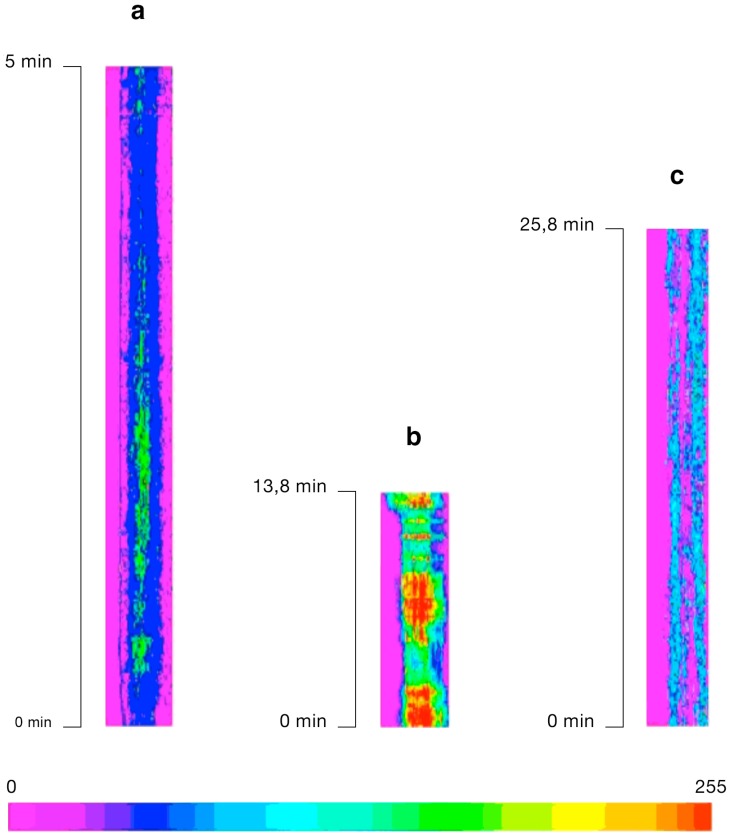
Figure 1.
Calcium dynamics in reconstructions of temporal sections obtained with the Line Image function of the Lucida software. The line trace plot is represented as pixel intensities converted into pseudocolor values in the Line Image. Rows in the Line Image correspond to successive images (x) along the active dimension, time (t). Thus, the Line Image is an (x,t) plot showing [Ca2+]cyt change along an axis through the “stack” image composed of the overlaid images taken successively during [Ca2+]cyt measurement. The increase in [Ca2+]cyt is represented by yellow-red bands. The bar represents a pseudocolor code of the pixel values digitized to 256 grey levels. (a) Line Image of an egg cell isolated three DAE, injected with fura-2 dextran and ratio-imaged following electrofusion with a sperm cell. The axis along which the [Ca2+]cyt changes were measured passed through the sperm entry site; (b) [Ca2+]cyt changes over time in a receptive egg cell (isolated six DAE) microinjected with fura-2 dextran and fertilized in vitro; (c) Time-lapse series of an axis “drawn” through time, the active dimension, in an overmature (18 DAE) egg cell fertilized in vitro following fura-2 dextran injection.

