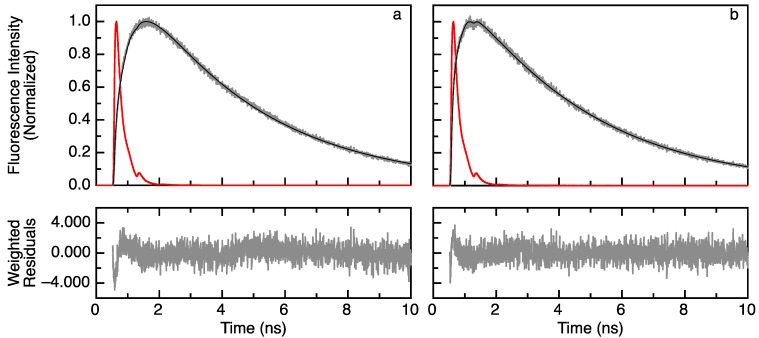
Figure 1.
Fluorescence lifetimes with corresponding negative and positive amplitudes characterize the time-resolved fluorescence of the acceptor upon donor excitation. (Top) The time dependence of experimental (grey) and fitted (black) fluorescence intensity of apoflavodoxin labeled with A488 (donor) and A568 (acceptor) (see the Experimental Section for details on the theoretical background, protein labeling and data acquisition and analysis). The decay of reference compound erythrosine B has a fluorescence lifetime of 89 ps (red line); (Bottom) The weighted residuals between experimental and fitted curves (grey lines). (a) Acceptor fluorescence of folded, double-labeled apoflavodoxin in 0 M GuHCl. The rise time is 0.51 ns (confidence limits at the 0.67 confidence level are 0.50 and 0.53 ns); decay time is 3.85 ns (confidence limits at the 0.67 confidence level are 3.84 and 3.86 ns). The absolute value of the amplitude ratio |A−/A+| is 0.44. The fit quality criterion χ2 is 1.226; and (b) Acceptor fluorescence of unfolded, double-labeled apoflavodoxin in 4.12 M GuHCl. The rise time is 1.57 ns (confidence limits at the 0.67 confidence level are 1.41 and 1.78 ns); decay time is 3.71 ns (confidence limits at the 0.67 confidence level are 3.67 and 3.73 ns). The absolute value of the amplitude ratio |A−/A+| is 0.134. The fit quality criterion χ2 is 1.085.

