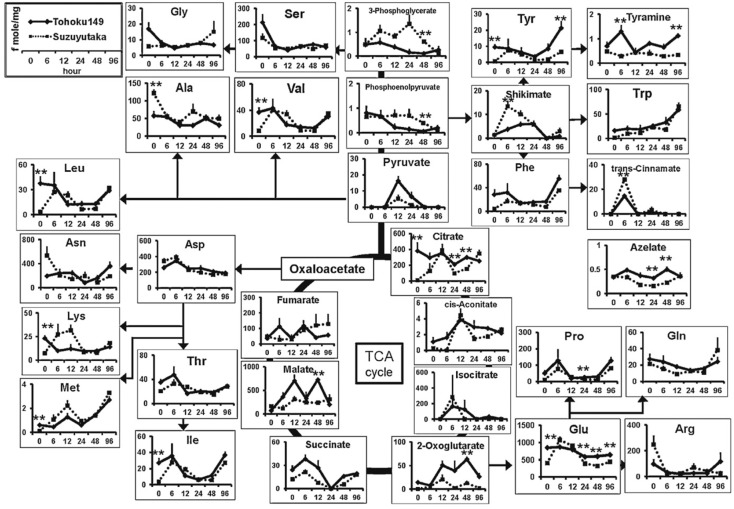
Figure 4.
Changes in the level of representative primary metabolites after aphid introduction. Data for the metabolite per mg of soybean leaves (wet weight) at 0–96 h after aphid introduction are plotted. Solid and dashed lines indicate the metabolite concentrations in Tohoku 149 (n = 5) and Suzuyutaka (n = 5), respectively. The data points are mean values and the error bars indicate the standard error. Asterisk (**) denotes statistical significance with p < 0.01. Reprinted with permission from [44].

