Fig. 3.
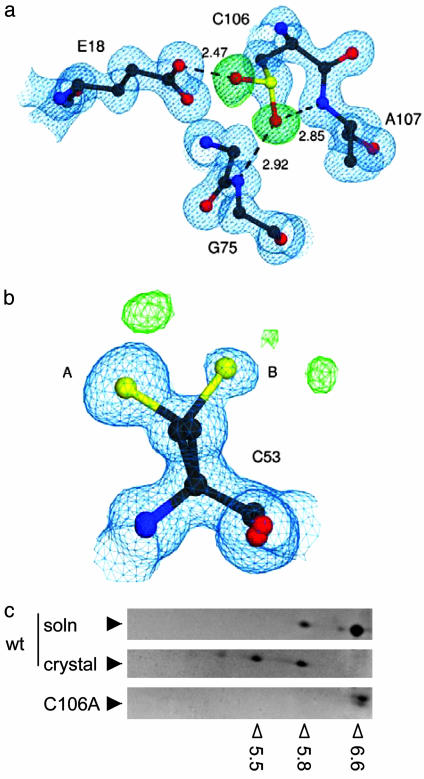
Identification of C106-SO2H in the crystal. (a) Immediate environment of C106-SO2H, with 2mFO-DFC electron density contoured at 1.0 σ (blue) and mFO-DFC electron density contoured at 4.0 σ (green) m and D are weights for the Fourier coefficients. Both electron density maps were calculated before the introduction of the Oδ1 and Oδ2 oxygen atoms of C106-SO2H. Dotted lines indicate hydrogen bonds between C106-SO2H and the surrounding residues E18, G75, and A107, with lengths in angstroms. (b) C53 is not modified to the same extent as C106, although this residue can adopt two conformations (A and B). Difference electron densities (green) represent probable minor modifications. This figure was made with povscript+ (28). (c) Accumulation of acidic pI isoforms after crystallization. Recombinant WT DJ-1 before (Top) or after crystallization (Middle) were separated on 2D gels and different isoforms identified by Coomassie staining. Note that the crystallization process induces a pI shift in the recombinant protein, although a basal level of oxidized protein is seen in solution. In contrast, C106A is present only as the most basic isoform (pI 6.6-6.8). Open arrowheads below the gels show experimentally determined pI values, which were calibrated with 2D gel standards; filled arrowheads indicate the position of DJ-1.

