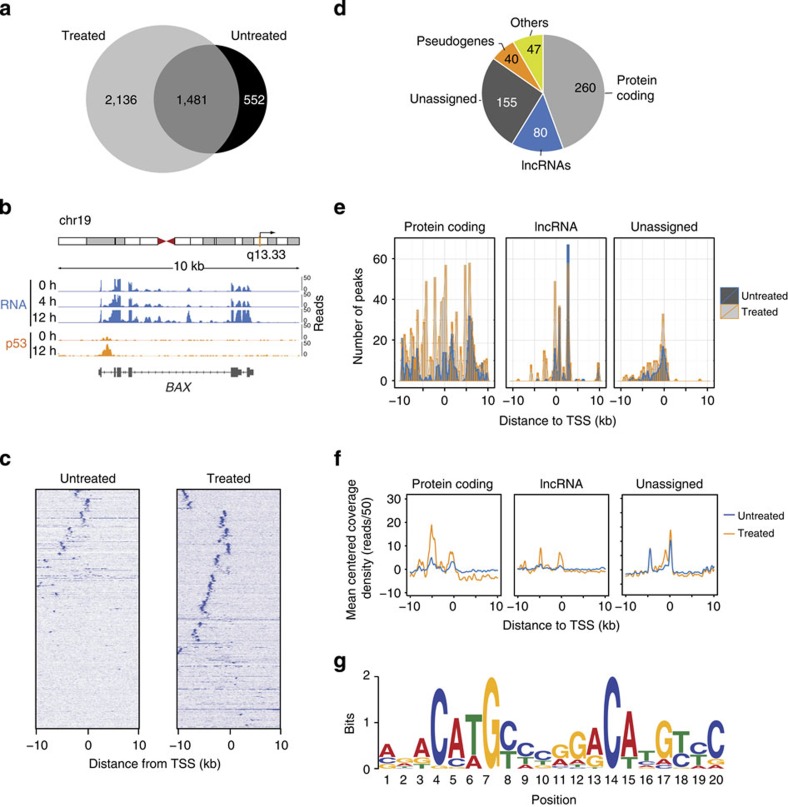
Figure 2. Genome-wide analysis of p53 binding.
(a) Total number of p53-binding loci identified by p53 ChIP-seq analysis of HCT116 cells untreated or treated with DNA damage for 12 h. (b) Schematic representation of the chromosomal location of the BAX gene locus, RNA-seq and p53 ChIP-seq signals at 0 and 12 h of 5-FU treatment. (c) Density heatmap of the p53-binding sites across 10 kb from the TSS of genes in untreated and treated HCT116 cells. (d) Distribution by biotypes of genes differentially expressed and bound by p53 upon DNA-damage treatment for 12 h. (e) Number of p53-binding sites and position along 10 kb from the TSS of the nearest gene separated into protein-coding, lncRNA or unassigned gene loci. (f) Distribution of ChIP-seq reads along 10 kb of distance from the nearest TSS of the indicated gene types. (g) p53 consensus motif defined by MEME motif analysis of the sequences of p53 ChIP-seq peaks of genes upregulated by DNA damage (P=4.9E−22, TOMTOM match statistic).

