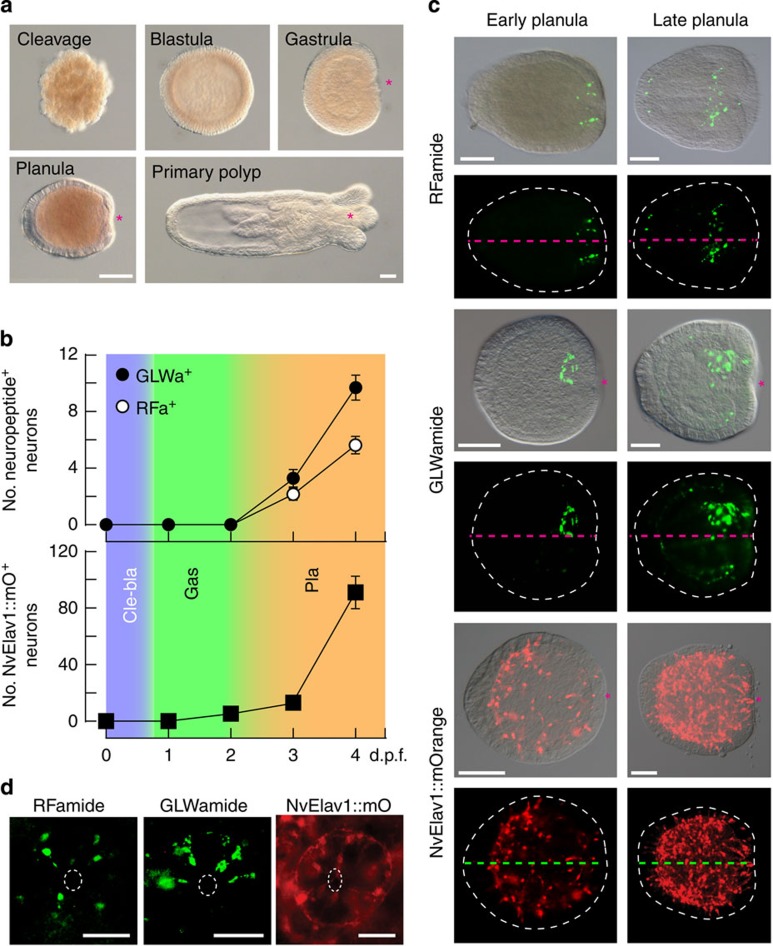
Figure 1. An asymmetry in the N. vectensis nervous system.
(a) Development of N. vectensis from cleavage to the primary polyp (differential interference contrast images). (b) Number of neurons expressing the mature neuropeptides RFamide and GLWamide (upper graph), and number of NvElav1::mOrange positive neurons (lower graph) at different days post fertilization (d.p.f.). Colours indicate cleavage/blastula (Cle-bla), gastrula (Gas) and planula (Pla) stage. The data represent the mean±s.e.m. of at least three experiments (n=486 RFamide, n=423 GLWamide and n=239 Elav). (c,d) Lateral view (c) and oral view (d) of RFa+, GLWa+ and NvElav1::mOrange+ neurons in planula larvae. The pink and green dotted lines in c denote the oral–aboral axis and the dotted white circles in d indicate the blastopore. Note that only GLWa+ neurons exhibit an additional bias along the orthogonal axis around the blastopore. Shown are representative images of at least three with similar results. The asterisks in a and c indicate the blastopore. Scale bars in a,c and d, 100 μm and 50 μm, respectively.

