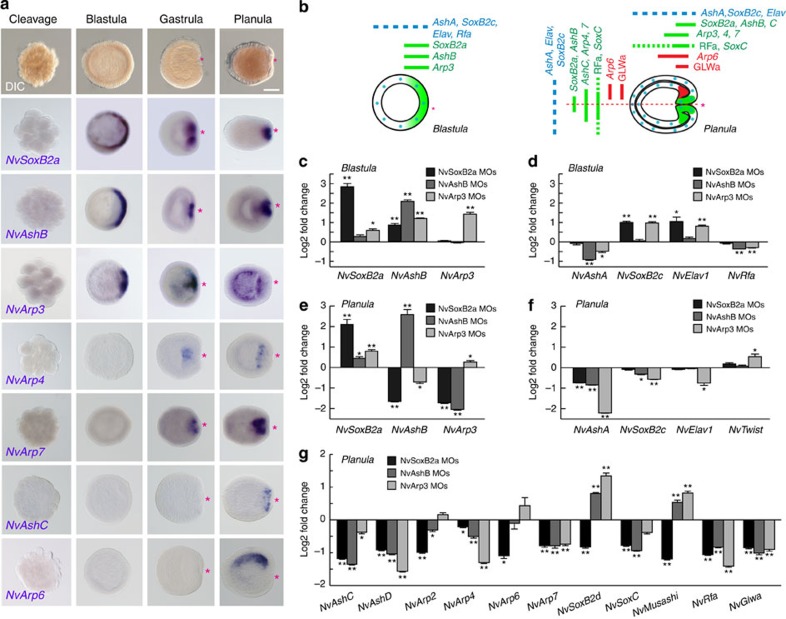
Figure 2. Action of early oral neurogenic genes.
(a) WISH assay of neural transcription factors. Red asterisks denote the blastopore and future oral pole. Shown are representative images of at least three with similar results. Note the late asymmetric expression of NvArp6 at the planula stage. Scale bar, 100 μm. (b) A schematic illustration of the expression patterns of oral and lateral neurogenic and marker genes at the blastula (left) and planula (right) stages. (c–g) qPCR analyses of the neural gene expression in the blastula (c,d) and planula (e,f) that were injected with MOs against NvSoxB2a, NvAshB or NvArp3. Bars represent the mean±s.e.m. of at least three experiments. The black asterisks denote the statistical significance using the Student’s t-test (*P<0.05, **P<0.01).

