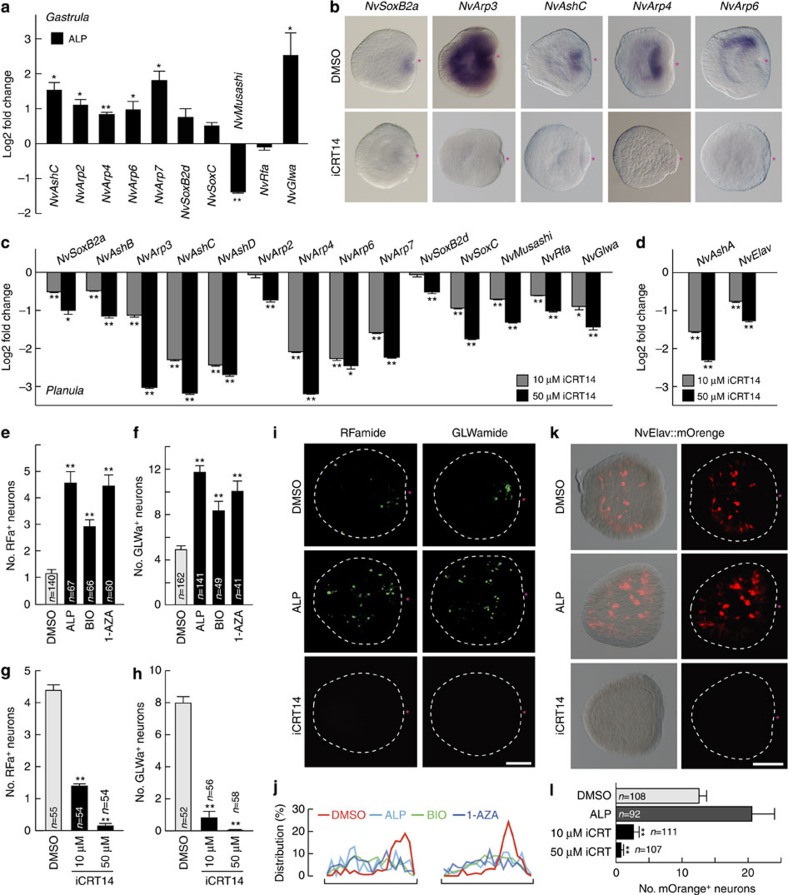
Figure 5. β-Catenin signalling positions neuronal genes to the oral site.
(a) qPCR analysis of late oral neural genes in 2.5 μM ALP-treated gastrula (16 h.p.f.). (b) WISH analysis of oral neurogenic transcription factors in the planula treated without (dimethyl sulfoxide (DMSO)) or with 50 μM iCRT14. (c,d) qPCR analyses of the oral and lateral neural gene expression in the iCRT14-treated planulae. (e–h) Quantification of number of RFa+ (e,g) and GLWa+ (f,h) neurons in the planula larvae treated with GSK3β inhibitors (2.5 μM ALP, 0.5 μM BIO or 2.5 μM 1-AZA) up to the blastula stage (e,f) or treated with increasing concentrations of iCRT14 up to the planula stage (g,h). Neurons were counted at 3 d.p.f. (e,f) or 4 d.p.f. (g,h). (i–l) Development of the RFa+ and GLWa+ neurons (I,j) and NvElav1::mOrange+ neurons (k,l) in the planula treated with 2.5 μM ALP (up to blastula) or 50 μM iCRT14. (j) Distributions of RFa+ (left) and GLWa+ (right) neurons along the OA axis of planulae treated with GSK3β inhibitors (2.5 μM ALP, 0.5 μM BIO or 2.5 μM 1-AZA) up to the blastula stage were plotted (n=9 (ctrl.), n=9 (ALP), n=6 (BIO) and n=6 (1-AZA) for RFa; n=21 (ctrl.), n=10 (ALP), n=9 (BIO) and n=7 (1-AZA) for GLWa). (l) Quantification of number of NvElav1::mOrange+ neurons in the planula larvae treated with 2.5 μM ALP increasing concentrations of iCRT14. Shown in i and k are representative images of at least three with similar results. Scale bars, 100 μm. The red asterisks in b,i and k denote the blastopore. Bars represent the mean±s.e.m. of three experiments. Black asterisks denote statistical significance using the Student’s t-test (*P<0.05; **P<0.01).

