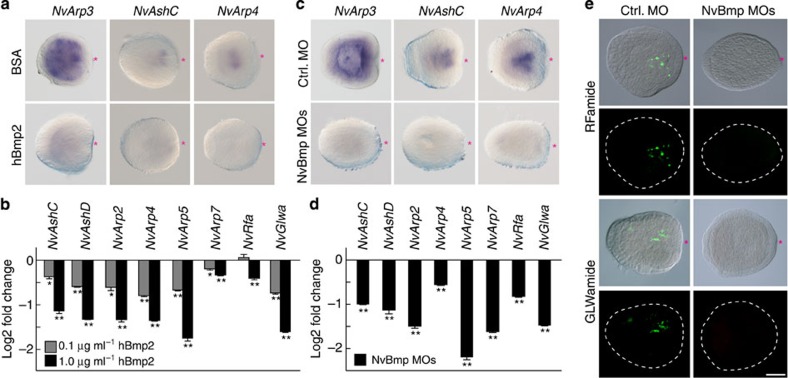
Figure 7. Bmp-dependent late neurogenesis.
(a–d) Expression analyses of oral neurogenic genes in the planulae treated with hBmp2 protein (a,b) or injected with MOs against NvBmp2/4 and NvBmp5–8 (c,d). WISH analysis shows the expression NvArp3, NvAshC and NvArp4 after hBmp2 (1.0 μg ml−1) treatment (a) or after Bmp MOs injection (c) at the planula stage. qPCR analyses show the expression of the oral neural genes at the planula larvae treated with increasing concentrations of hBmp2 (b) or injected with Bmp MOs (d). (e) Development of the RFa+ and GLWa+ neurons in NvBmp morphants. Shown in a,c and e are representative images of three experiments with similar results. Red asterisks indicate the blastopore. Scale bars, 100 μm. Bars represent the mean±s.e.m. of at least three experiments. Black asterisks denote statistical significance using the Student’s t-test (*P<0.05; **P<0.01).

