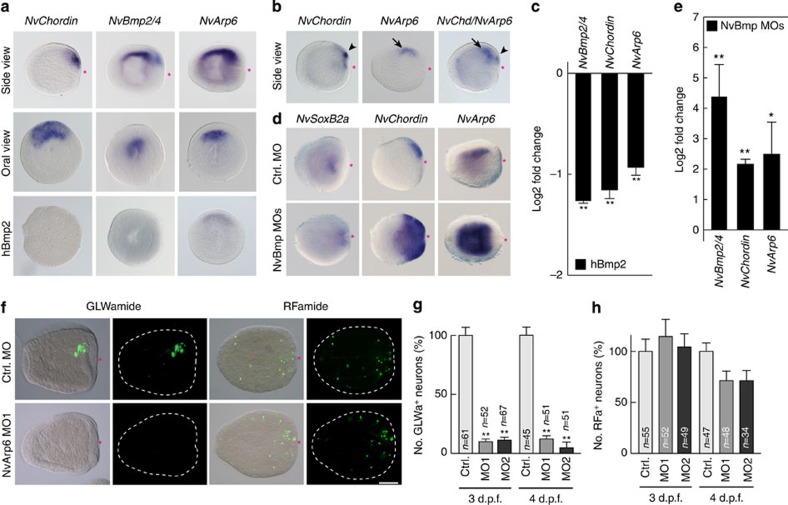
Figure 8. Asymmetric differentiation of GLWa+ neurons by Bmp and NvArp6.
(a–e) WISH (a,b) shows the expression of NvChordin, NvBmp2/4 and NvArp6 on the same site along the directive axis at the planula stage. Arrowheads and arrows in b indicate expression of NvChordin and NvArp6, respectively. Influence of 1 μg ml−1 hBmp2 treatment on the expression of NvArp6, NvBmp2/4 and NvChordin is shown in the lower panel of a. (c) qPCR analysis of NvBmp2/4, NvChordin and NvArp6 in planulae treated with 1 μg ml−1 hBmp2. (d) WISH analysis of NvSoxB2a, NvChordin and NvArp6 expression in Bmp morphants. (e) qPCR analysis of NvBmp2/4, NvChordin and NvArp6 in Bmp morphants. Bars in c and e represent the mean±s.e.m. of three experiments. (f–h) NvArp6-dependent asymmetric formation of GLWa+ neurons. Immunocytochemical analysis of GLWa+ and RFa+ neurons (f) and quantification of GLWa+ (g) and RFa+ (h) neuron formation in NvArp6 morphants. The data in g and h represent the relative number of neurons. The bars represent the mean±s.e.m. Black asterisks denote statistical significance (*P<0.05; **P<0.01). Shown in a,b,d and f are representative images of three experiments with similar results. Red asterisks indicate blastopore. Scale bars, 100 μm.

