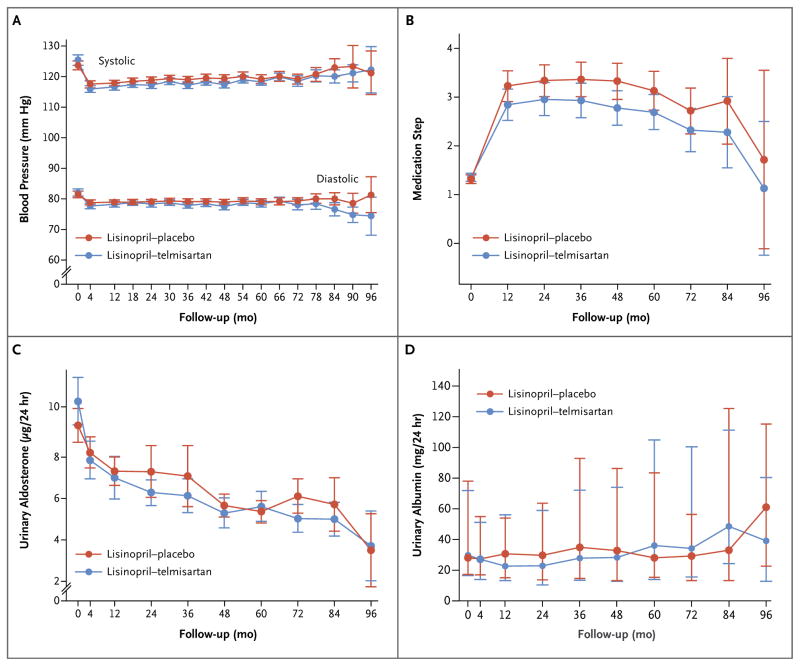
Figure 2. Blood-Pressure Levels, Medication Steps, and Urinary Aldosterone and Albumin Excretion.
The graphs show the mean systolic and diastolic blood pressures (Panel A), steps in the medication-dose adjustments (Panel B, and Table S1 in the Supplementary Appendix), urinary aldosterone excretion (Panel C), and median urinary albumin excretion (Panel D) in participants treated with lisinopril–telmisartan and those who received lisinopril–placebo. I bars indicate 95% confidence intervals (Panels A, B, and C) or interquartile ranges (Panel D).

