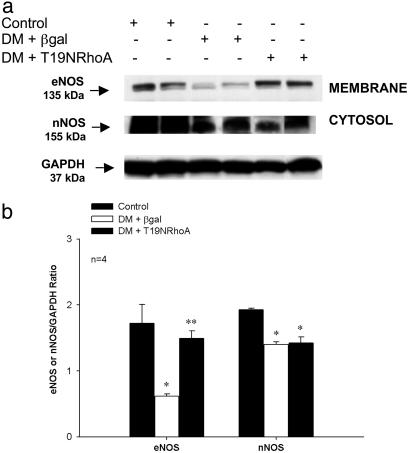
Fig. 4.
Effect of diabetes on corporal eNOS and nNOS protein expression. (a) Western blot analysis demonstrating corporal expression of eNOS, nNOS, and GAPDH protein in control (lanes 1 and 2) and 7 days after gene transfer of AAVCMVβgal (lanes 3 and 4) or AAVCMVT19NRhoA (lanes 5 and 6) in STZ-diabetic rats. (b) Densitometry analysis of eNOS and nNOS protein. *, P < 0.05 when compared to control; **, P < 0.05 when compared to STZ-diabetic tissue transfected with AAVCMVβgal.

