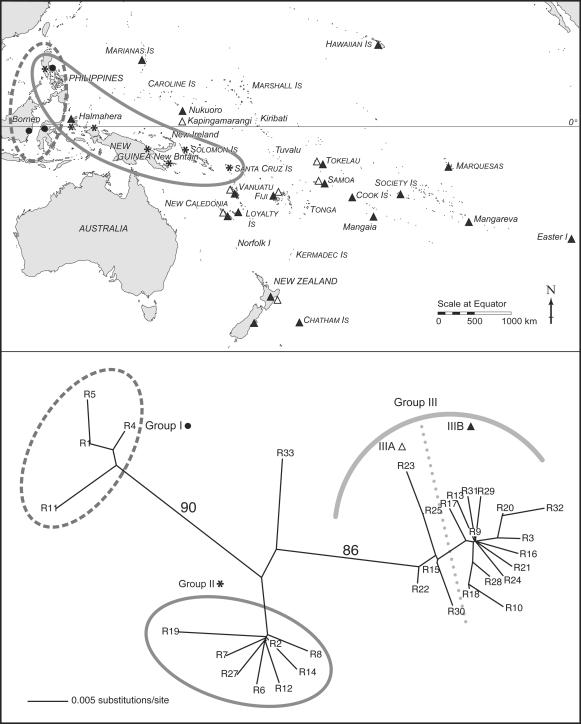
Fig. 2.
An unrooted NJ tree and map of the Pacific showing location of samples and associated haplogroups. Bootstrap values for main branches are shown. Ellipses and symbols identify regions associated with particular haplogroups: filled circle, haplogroup I; asterisk, haplogroup II; open triangle, haplogroup IIIa; filled triangle, haplogroup IIIb. Haplotype R33 represents the three Thai samples.

