
Figure 2.
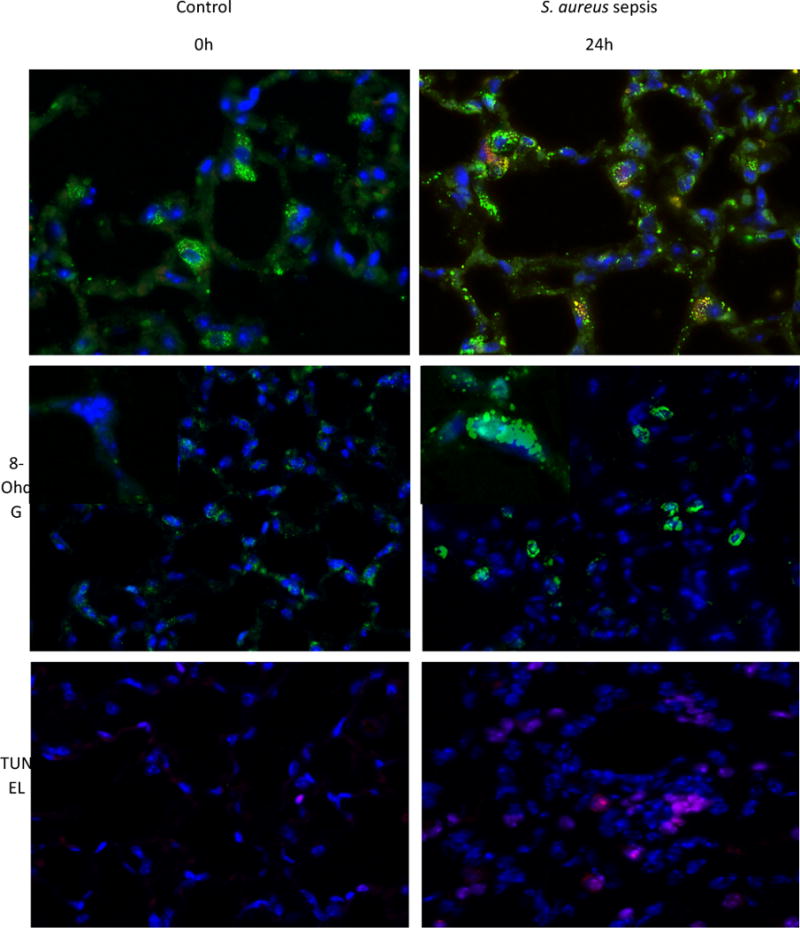
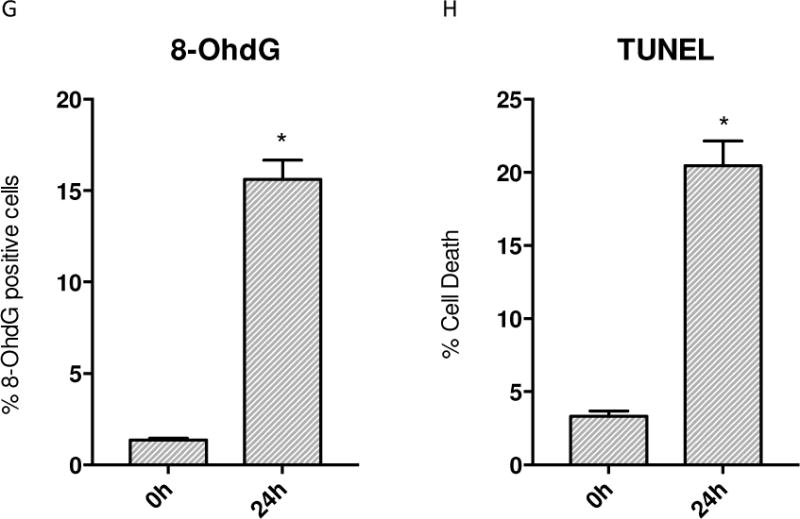
Immunofluorescence of WT mice given S. aureus 1×10⁷ CFU at 24h stained for ssDNA. A) The control mouse shows low fluorescence of ssDNA (stained red) that is colocalized with SOD2 (green) B) Sepsis increases the amount of ssDNA present. C) Control WT mouse lung stained for 8-OhdG (green) D) WT mouse lung stained for 8-OhdG at 24h after clot implantation. E) Control WT mouse lung with TUNEL staining at 0h. F) WT mouse lung with TUNEL staining after 24h after clot implantation. G) Quantified panels C&D for 8-OhdG positive cells. H) Quantified data from panels E&F for presence of cell death. (* P < 0.05 vs. time 0h)