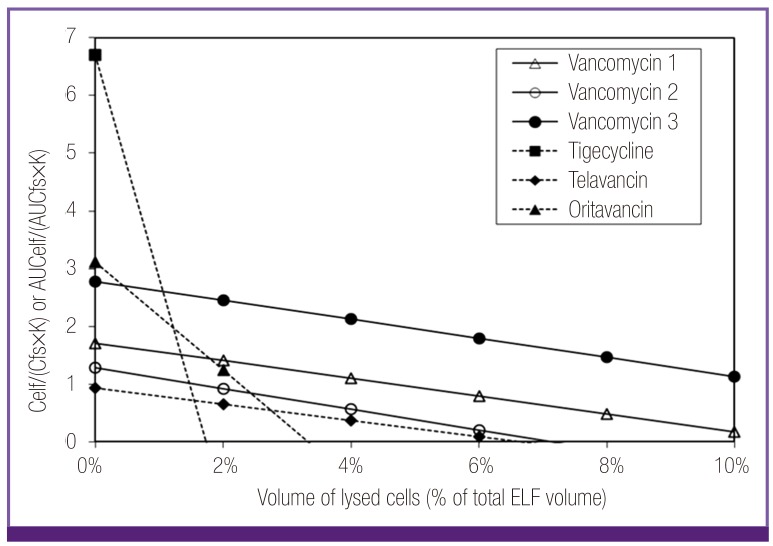
Figure 1.
Plot of ELF/free serum concentration ratios of oritavancin, telavancin, tigecycline and vancomycin considering penetration capacity (constant K) and potential lysis of ELF cells. Low ratios of telavancin and vancomycin were considered to be related to their low penetration capacity. High ratios of oritavancin and tigecycline beyond their penetration capacity could be explained with contamination from lysed ELF cells within the range of the volume percentage of the cells (3-10%) in ELF.
Celf, ELF concentration; Cfs, free serum concentration; K, constant K=0.96 + 0.091·ln (partition coefficient · molecular weight-1/2); AUCelf, AUC in ELF; AUCfs, free AUC in serum; ELF, epithelial lining fluid; AUC, area under the curve.

