
Table 2.
Antibiotic concentrations in ELF and alveolar macrophage cells comparing to serum levels
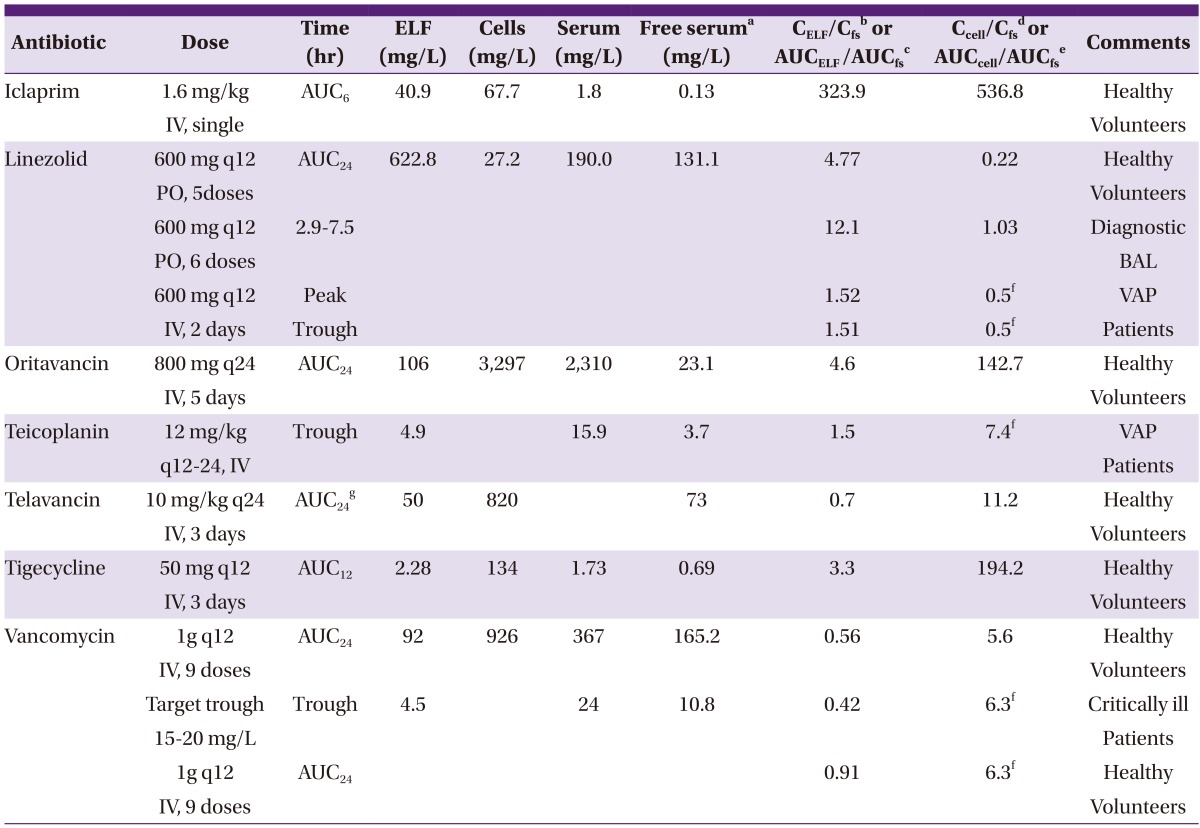
aFree serum concentrations or AUCs(area under the curve) were calculated from the protein binding levels of the corresponding antibiotics.
bCELF/Cfs, ratio of antibiotic concentrations in ELF comparing to their free serum levels.
cAUCELF/AUCfs, ratio of AUC of antibiotic concentrations in ELF comparing to their free serum AUC.
dCcell/Cfs, ratio of intracellular antibiotic concentrations comparing to their free serum levels.
eAUCcell/AUCfs, ratio of AUC of intracellular antibiotic concentrations comparing to their free serum AUC.
fRatios of intracellular concentration to free serum levels were adopted from a study evaluating antibiotic activities in human THP-1 macrophages versus those in culture medium (Reference 14).
gAUCs were calculated from approximate antibiotic levels retrieved from time-concentration graphs.
ELF, epithelial lining fluid; AUC, area under the curve; BAL, bronchoalveolar lavage; VAP, ventilator associated pneumonia; IV, intravenous; PO, by mouth(per os).