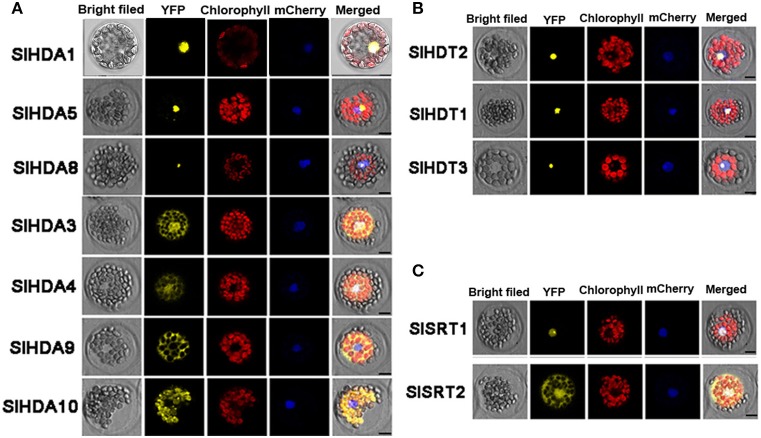
Figure 3.
Protoplast transient expression analysis using HDAC-YFP fusion constructs. Subcellular location of RPD3/HDA1 (A), HD2 (B), and SRT2 (C) family HDACs was determined via Arabidopsis protoplast PEG transfection using HDAC-YFP fusion constructs. Red color indicated autofluorescence emitted by chloroplasts. The blue color indicates the nucleus using the mCherry as the nuclear marker. Bar represents 7.5 μm.

