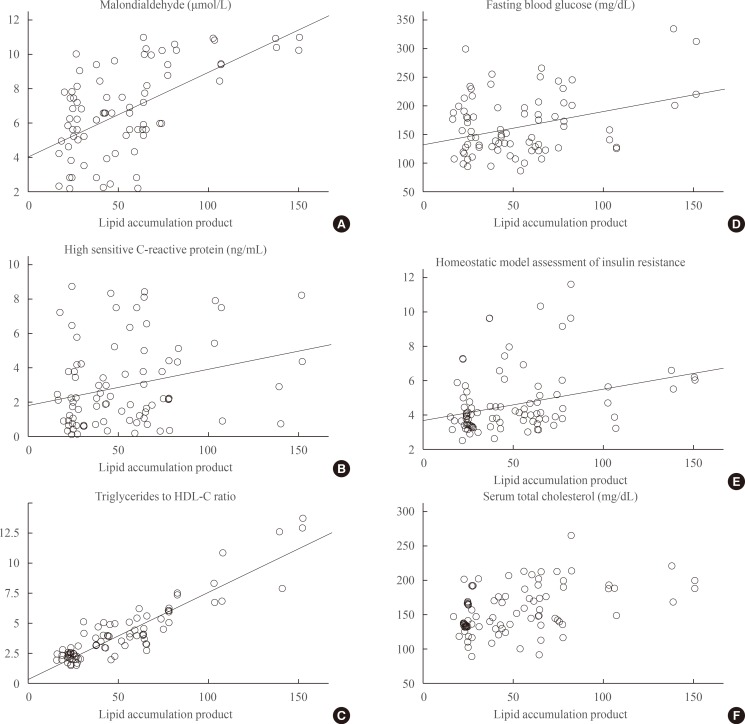
Fig. 1.
Linear association of lipid accumulation product (LAP) and metabolic parameters in type 2 diabetic patients (regression curve estimation models were used). (A) Linear association of LAP and malondialdehyde (β=0.58, P<0.01). (B) Linear association of LAP with C-reactive protein (β=0.27, P<0.05). (C) Linear association of LAP with the triglycerides to high density lipoprotein cholesterol (HDL-C) ratio (β=0.91, P<0.01). (D) Linear association of LAP with fasting serum glucose (β=0.39, P<0.05). (E) Linear association of LAP with homeostasis model assessment of insulin resistance (β=0.31, P<0.05). (F) Linear association of LAP with serum total cholesterol (β=0.42, P<0.01).

