. 2013 Oct 16;4(12):4512–4519. doi: 10.1039/c3sc51725j

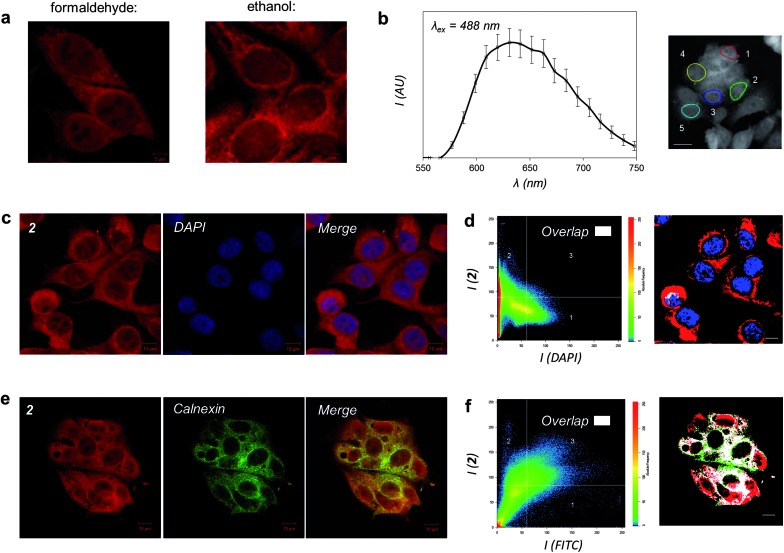
Fig. 5. Cellular imaging properties of 2. (a) MCF-7 cells stained by 2 after treatment with formaldehyde or ethanol fixation and visualised by MLCT excitation/emission wavelengths. (b) Emission profile of 2 in formaldehyde-fixed cells (λ ex = 488 nm). Data presented as average emission of 5 regions of interest (right). (c) Co-staining with 2 and DNA dye DAPI. (d) Co-localization analysis of 2 and DAPI emission. Regions solely stained by 2 are labelled red, DAPI-exclusive regions blue, and regions of overlap of the two emission signals white. (e) Co-staining of cells stained with 2 and ER-localized calnexin protein, as visualized by immunofluorescence (FITC-conjugated secondary antibody). (f) Co-localization analysis of 2 and FITC emission where the region of overlapping signals is labelled in white. Scale bars in b, d, and f = 10 μm.

Fig. 5