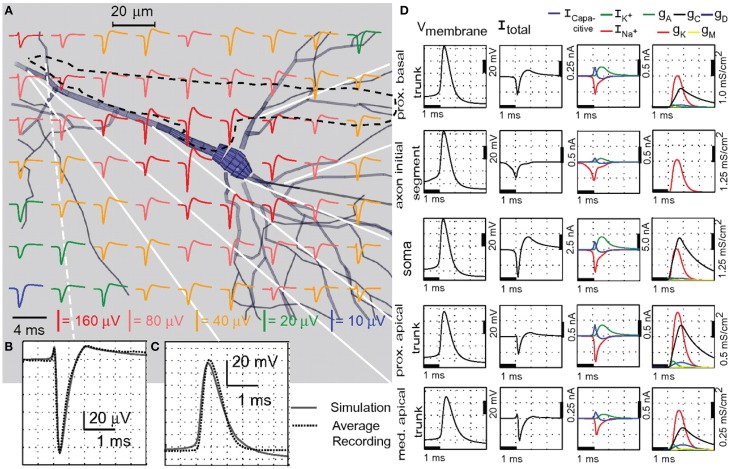
Figure 14.
Ion channel density estimation. Adapted from Gold et al. (2006). (A) The extracellular action potentials (EAPs) solved in a grid from the multicompartmental model of a CA1 pyramidal neuron. The dotted black line indicates the tip of the electrode used to measure the EAPs. (B) Enlarged image of the EAP at the electrode tip. Location is indicated by the white dotted line in (A). Solid line in the plot corresponds to the simulated EAP, which is superimposed with the recorded EAP shown as dotted line. (C) Comparison of the simulated intracellular signal (solid line) at the proximal apical trunk to the intracellular recording (dotted line). (D) First column: The details of the intracellular signal simulation for each compartment. White solid lines in (A) indicate the locations of the compartments. Second column: The simulated membrane currents in the same compartments as the first column. The net membrane current across the soma and proximal dendrites best estimates the EAP waveform. Third column: Membrane current components in terms of Na+, K+, and mixed-ion capacitive current. Last column: Conductivity densities of the A, C, D, K, and M type K+ currents. For further details, see Gold et al. (2006).

