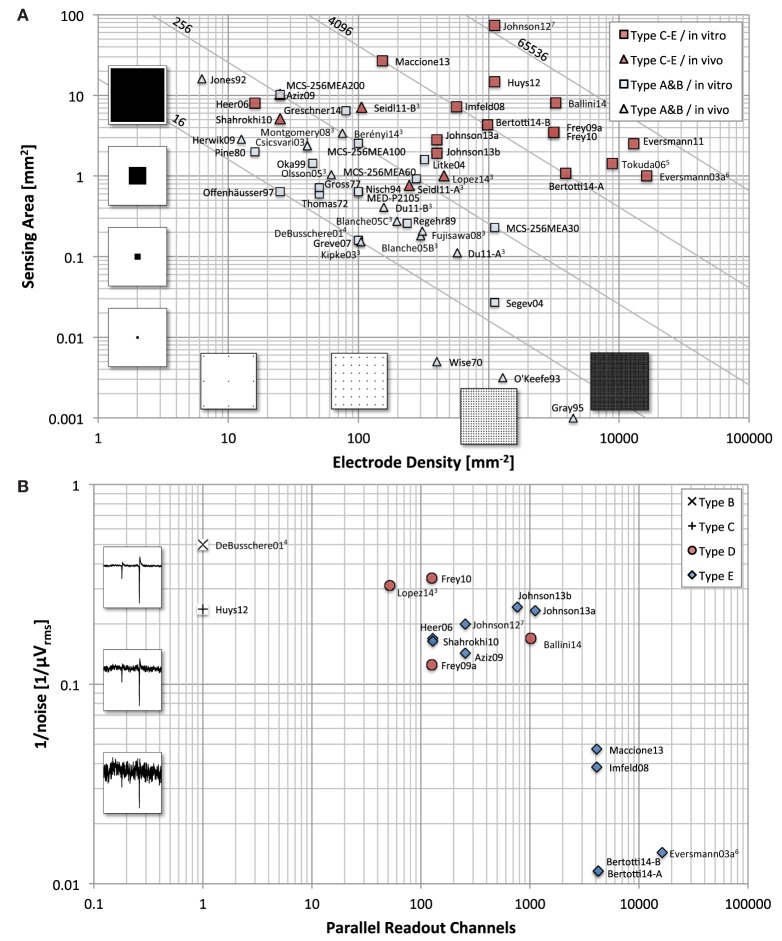
Figure 2.
Device comparison. MEA comparison with respect to (A) electrode density and total sensing area, and (B) parallel recording channel count and noise level. (A) For devices with a regular sensor pitch, such as most in vitro MEA devices, the total area is calculated as number of electrodes times the pixel area. For all devices, the number of electrode times the inverse of the electrode density matches the total area. The light gray lines illustrate the number of electrodes. (B) The noise values shown are approximated RMS values stated in the respective citations. The conditions under which these measurements were taken usually differ significantly (such as noise bandwidth, in- or exclusion of electrode noise, inclusion of ADC quantization noise, etc.). Therefore, this graph only serves as a rough comparison. The waveforms to illustrate the noise levels are simulated and have a spectrum typical for MEA recordings. The simulated spikes are typical spikes for acute brain slice measurements recorded with microelectrodes. The recorded amplitudes may vary significantly depending on preparation and sensor characteristics. See Footnotes:3,4,5,6,7.

