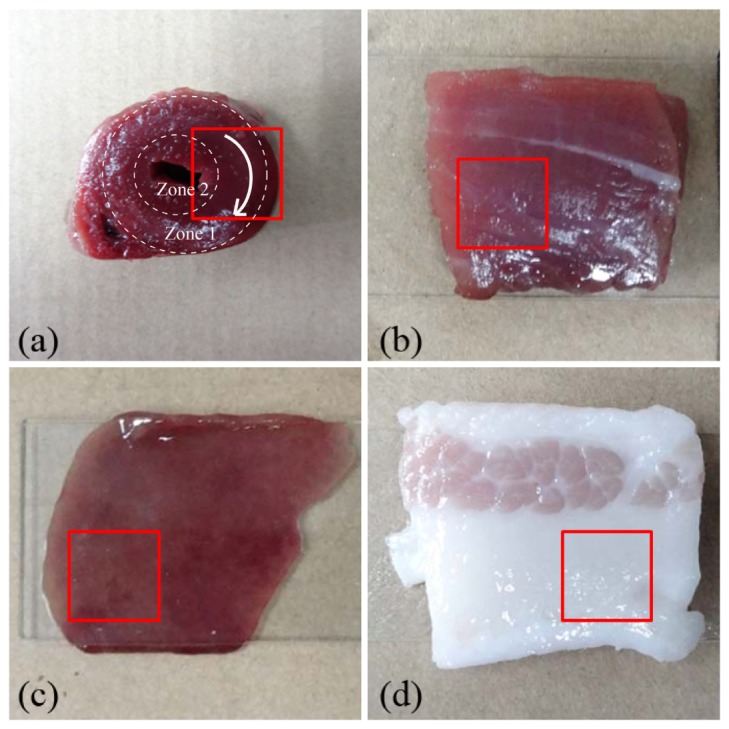
Fig. 2.

Photographs of the biological samples: (a) chicken heart tissue, (b) bovine skeletal muscle tissue, (c) porcine liver tissue, (d) porcine fat tissue. In order to show more structural details of the tissues, we choose 1 cm × 1 cm squares from the illumination areas as the imaging regions, which are marked by the red squares. For the chicken heart sample, zone 1 contains muscle fibers aligned parallel to the imaging X-Y plane, the white arrow line indicates the orientation of muscle fibers; zone 2 contains randomly oriented muscle fibers [24,25].
