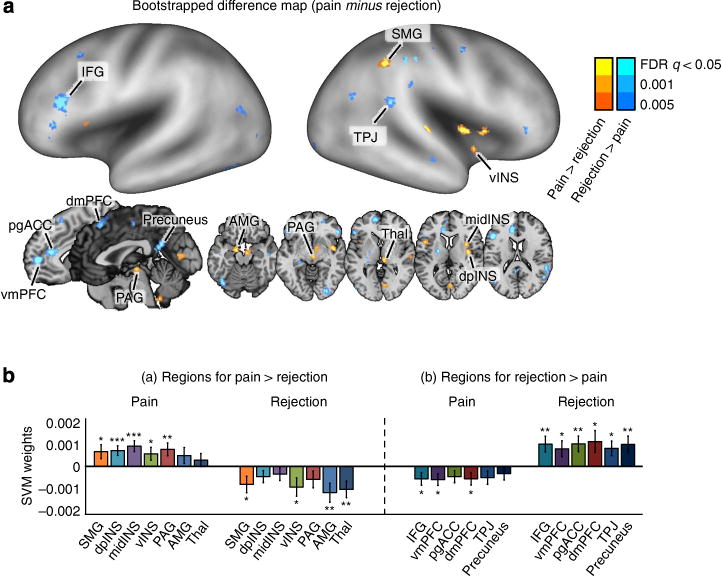
Figure 3. The difference map between the fMRI pattern-based classifiers for pain and rejection.

(a) The difference map in which values represent reliable differences between two discriminant weights (SVM weights for pain minus SVM weights for rejection) based on bootstrapping of SVMs (10,000 samples). The difference map is thresholded at q<0.05, FDR corrected. AMG, amygdala; dpINS, dorsal posterior insula; IFG, inferior frontal gyrus; midINS, middle insula; PAG, periaqueductal gray; pgACC, pregenual anterior cingulate cortex; preSMA, pre-supplementary motor area; SMG, supramarginal gyrus; Thal, thalamus; TPJ, temporal parietal junction; vINS, ventral insula; vmPFC, ventromedial prefrontal cortex. (b) Mean SVM weights for contiguous regions within the difference map (10,000 samples). The error bars represent standard error of the mean based on bootstrapping. *P<0.05, **P<0.01, ***P<0.001, one-sample t-test.
