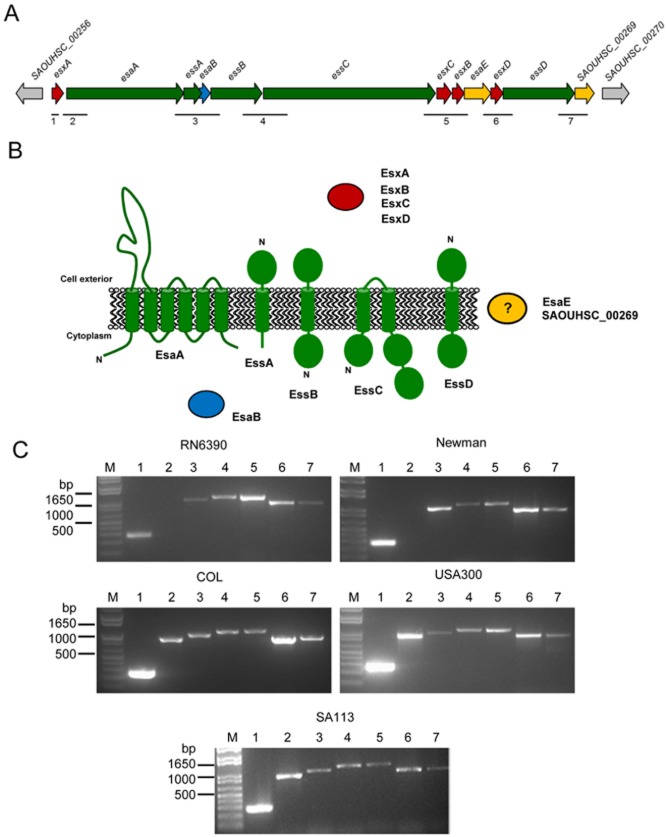
Figure 1.
Organization of the ess locus in different strains of S. aureus.
A. Schematic representation of the S. aureus ess locus derived from the NCTC8325 genome sequence. The region from the start of esxA to the end of SAOUHSC_00269 covers approximately 14 kb and is almost 100% identical between the RN6390, Newman, COL and USA300 strains (only two nucleotide differences over this region). Genes encoding secreted substrates are coloured in red, membrane components in green, cytoplasmic components in blue and unknown components in orange. Putative unrelated genes are shaded in grey. Note that the sizes of the intergenic regions are as follows: SAOUHSC_00256-esxA, 247 bp; esxA-esaA, 83 bp; esaA-essA, −1 bp; essA-esaB, −68 bp; esaB-essB, 12 bp; essB-essC, 21 bp; essC-esxC, 29 bp; esxC-esxB, 15 bp; esxB-esaE, −1 bp; esaE-esxD, −1 bp; esxD-essD, 9 bp; essD-SAOUHSC_00269, 10 bp; SAOUHSC_00269-SAOUHSC_00270, 207 bp.
B. Schematic representation of subcellular location and predicted topologies of the proteins encoded at the ess locus (not to scale). Shading as in part A.
C. RT-PCR analysis of mRNA isolated from each of the five different strains, using primer pairs listed in Table S1. The expected sizes for PCR products 1–7 are 272, 953, 1023, 1153, 1168, 959 and 946 bp respectively.

